Charts ECDIS-E User Guide
4-68 65934012
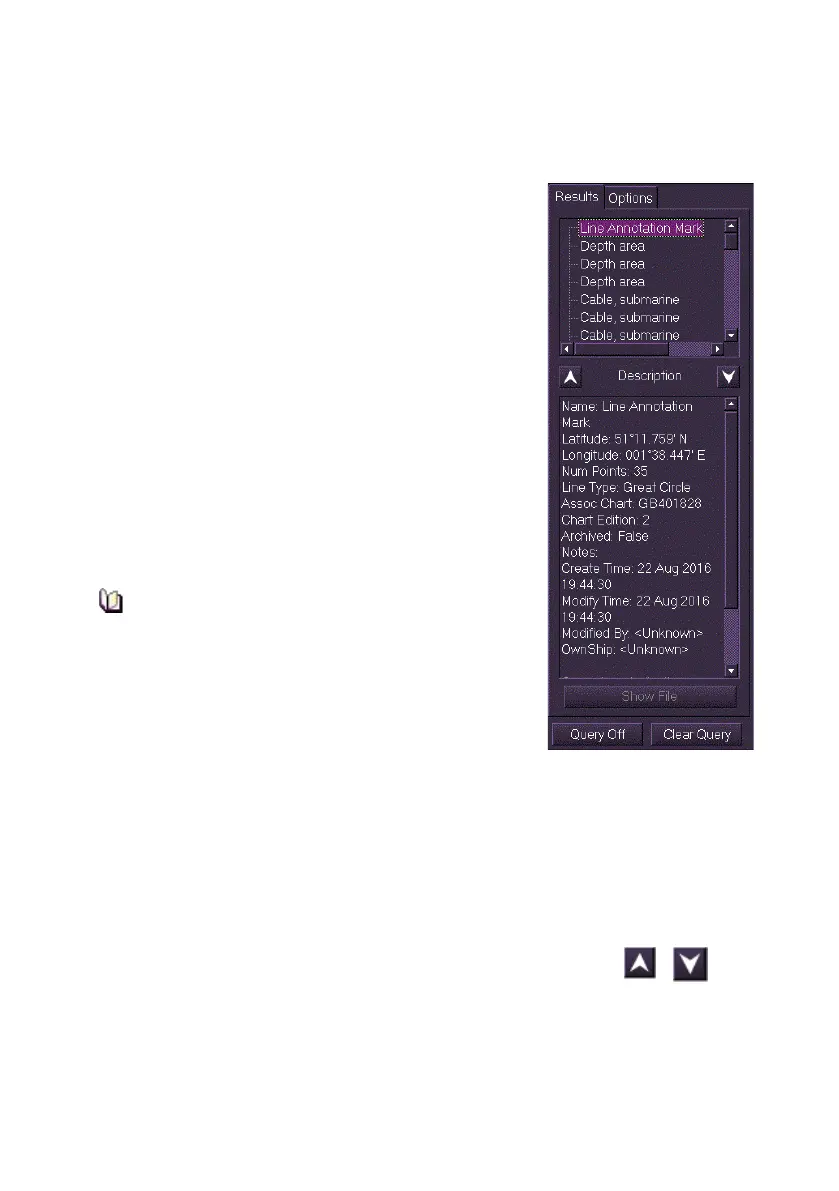
Query Features
Query Results
The Query Results folder includes an objects list,
object description panel, and navigation controls.
The Results tab lists all the ENC objects found in
the chart query area. The size of the query area can
be small, medium or large, see Query Options
Description Panel
The Description area contains detailed read-only
information for the currently selected object. This
includes a description of the type of chart object
selected, its chart position, its Dataset reference
number (the chart displayed at the query position)
and any date dependences that have been applied
to the object
The information changes as other objects are
selected from the Results list.
Attribute values and definitions connected
with chart objects are provided in the Results
tab folder in short form only for ease of
viewing. Full and comprehensive definitions
are available for viewing on a separate CD,
which was provided in the document pack
that accompanied this product. This contains
a copy of the applicable Standard S-57 (Appendix A, Chapter 2).
Selecting an Object for Query
To select a chart object for query, do the following:
1. Right click in the chart display and select Query Chart. A white
dashed line appears in the selected area of the chart and the
Results tab lists the chart objects that fall or bisect that area
2. To navigate up and down the objects list click on the
up/down navigation arrows .
3. The object selected in the Results folder is highlighted on the chart
display with a graphic dependant on the group type selected.
 Loading...