5.3.3.3 (Channel) Equalizer Page
Each channel has a parametric four-band equalizer. If the user has no access
permission to the EQ parameters, the EQ page is not displayed.
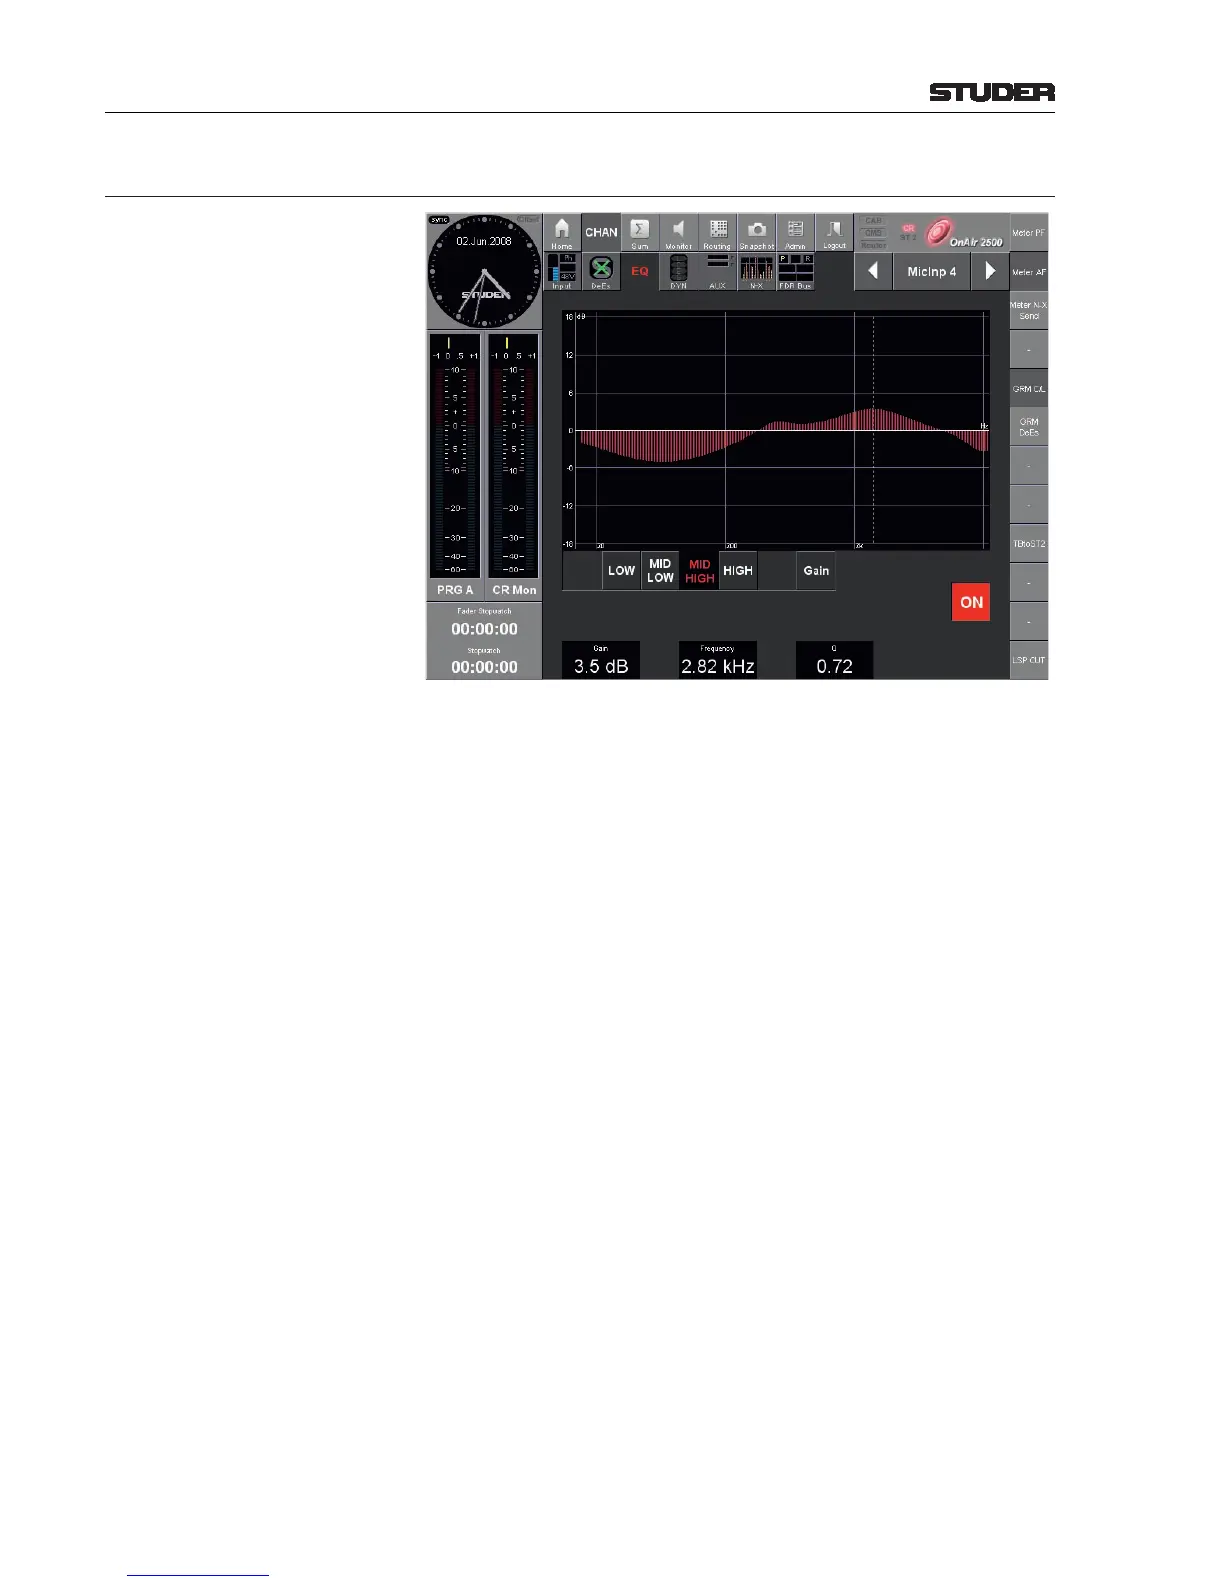
Graph The red graph represents the EQ’s current frequency response curve, cumu-
lated from all filters.
LOW, MID LOW, MID HIGH, HIGH
Touching one of these edit buttons selects one of the four frequency bands for
adjustment. The corresponding, exact Gain, Frequency, and Q (bandwidth)
values appear in the fields above the rotary encoders and can be adjusted. The
current frequency response curve is displayed in the EQ screen.
Gain The gain (boost/cut value) of the selected band is displayed in dB and can be
adjusted in a ±18 dB range with the rotary encoder below the field.
Frequency The center frequency of the selected band is indicated by a vertical, dashed
line, as well as displayed in Hz/kHz. It can be adjusted from 20 Hz to 20 kHz
with the rotary encoder below the field.
Q (Bandwidth) The Q factor of each band is displayed as a plain number and can be adjusted
from 0.27 (wide) to 8.7 (narrow) with the rotary encoder below the field.
Should a very high-Q (i.e. narrow) and/or very high/low gain band-pass (peak)
or band-stop (notch) filter be required, this can be realized by tuning two or
more of the EQ bands to the same frequency and selecting appropriate Q and
Gain values.
Gain Button Touching the Gain button displays the gain values of all four EQ bands in
the fields above the rotary encoders for adjustment; the center frequencies are
indicated by four vertical, dashed lines.
ON Button to enable/disable the complete EQ/filter section of this channel; high-
lighted if on. If off, the graph gets grayed out.