Transponder Operation
SkyView HDX Pilot’s User Guide – Revision B 6-5
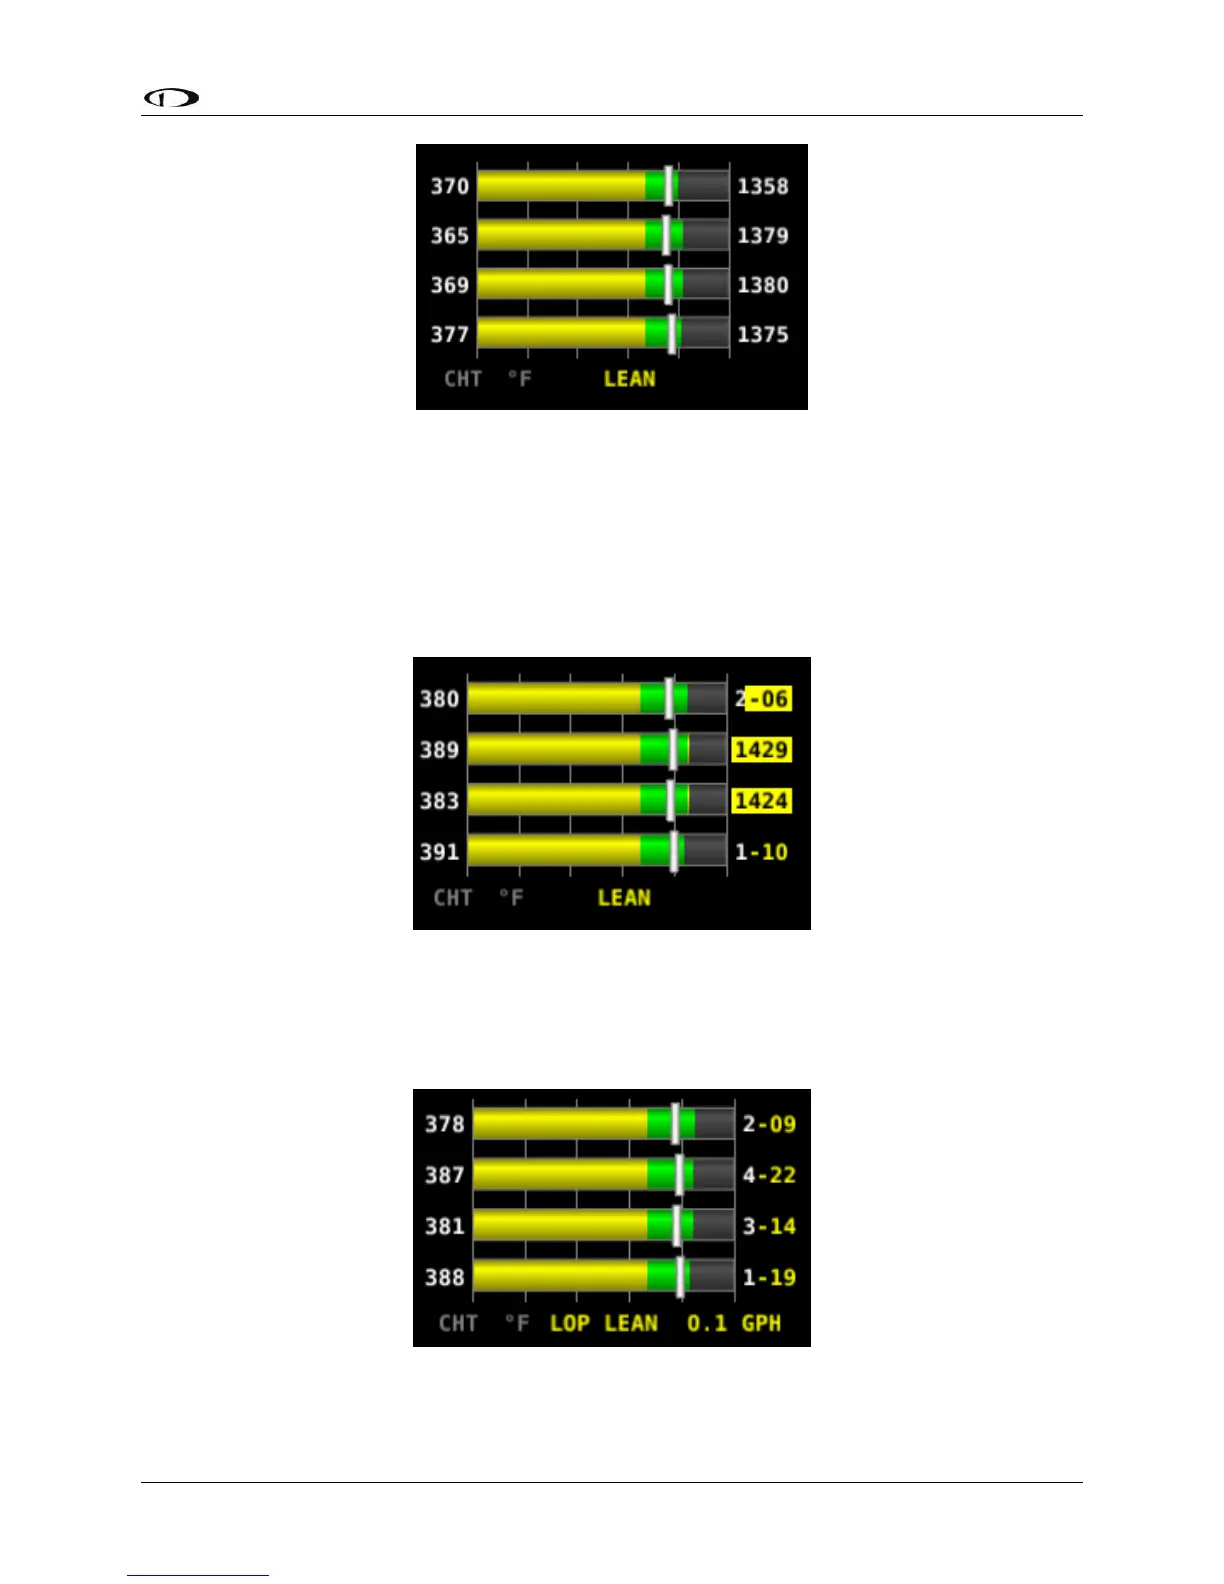
Figure 197 – Entering Lean Mode
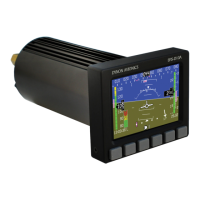
As each cylinder peaks, the cylinder numbers on the left side of the EGT bars are replaced by a
number indicating the cylinder peak sequence, followed by the difference from its peak
temperature (on combined EGT/CHT graphs pages, this information replaces the EGT
temperature itself due to space constraints). Given this information, you may set your mixture
more accurately to achieve a given EGT delta value on either the rich or lean side of peak EGT.
This is depicted in Figure 198.
Figure 198 – EGTs Peaking
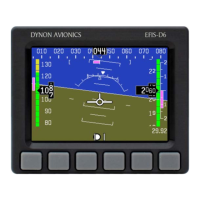
After the last cylinder peaks during a leaning operation the difference in fuel flow between the
first and last cylinder peaks is displayed. If the fuel flow decreases, it is shown as Lean of Peak. If
fuel flow increases, it is shown as Rich of Peak. This is depicted in Figure 199.
Figure 199 – Lean of Peak