Graphical View Screen 59
User Guide v 2.0 — March 2023 Making Adjustments
Table 7-2 gives the descriptions for the bars shown on the Graphical View screen.
Table 7-2 Bar Descriptions
Item Description
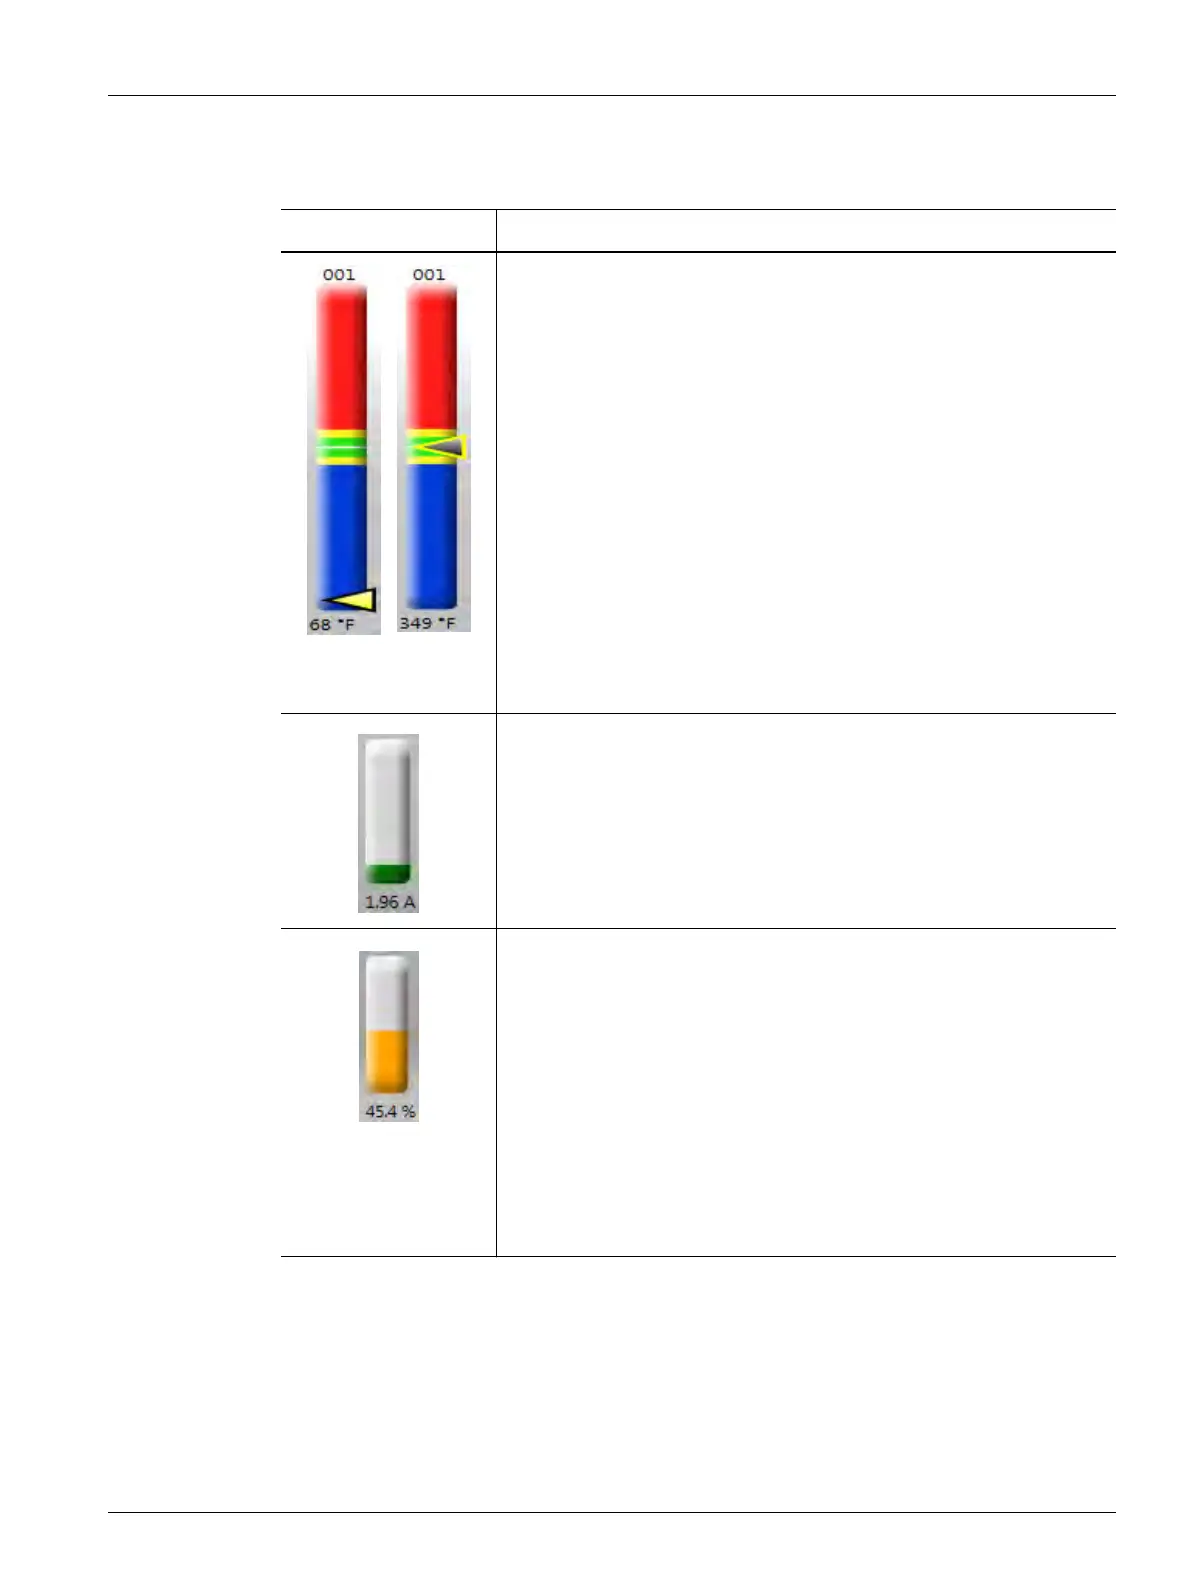
Temperature Bars
Each bar on the screen graphically shows the temperature control for one
zone. Each bar is labeled above with the zone number. The text shown at
the bottom of each bar is the actual temperature for that zone.
The different colors in each bar have a different meaning.
• The green area is the molding window.
• The white hairline is the setpoint.
• The yellow areas in the zone bar are the alarm ranges.
• The red and blue areas in the zone bar are the abort ranges.
• A blank gray bar shows that the zone is OFF.
• The arrow is the actual temperature.
- If the arrow is yellow, the temperature is not within the graph
range.
- If the arrow is black and splits the line, the temperature is at the
setpoint.
Amperage Bars
The amperage bars are below the zone bars. These show the amperage
that is drawn by each heater. The text shown at the bottom of each bar is
the actual current for that zone.
Power Bars
The power bars are located below the amperage bars. These show the
percentage of power that is supplied to the heater. The text at the
bottom of each bar is the actual power output percentage that is
supplied to that zone.
• If a zone is in Auto (closed loop) regulation, the bar will fill with
orange to show the percentage of power output.
• If a zone is in Manual (open loop) regulation, the bar will fill with
green to show the percentage of power output.
• If a zone is set to Monitor mode, the bar will remain grey (there is no
power output for zones set to Monitor mode).