9 Monitoring SpO2
196
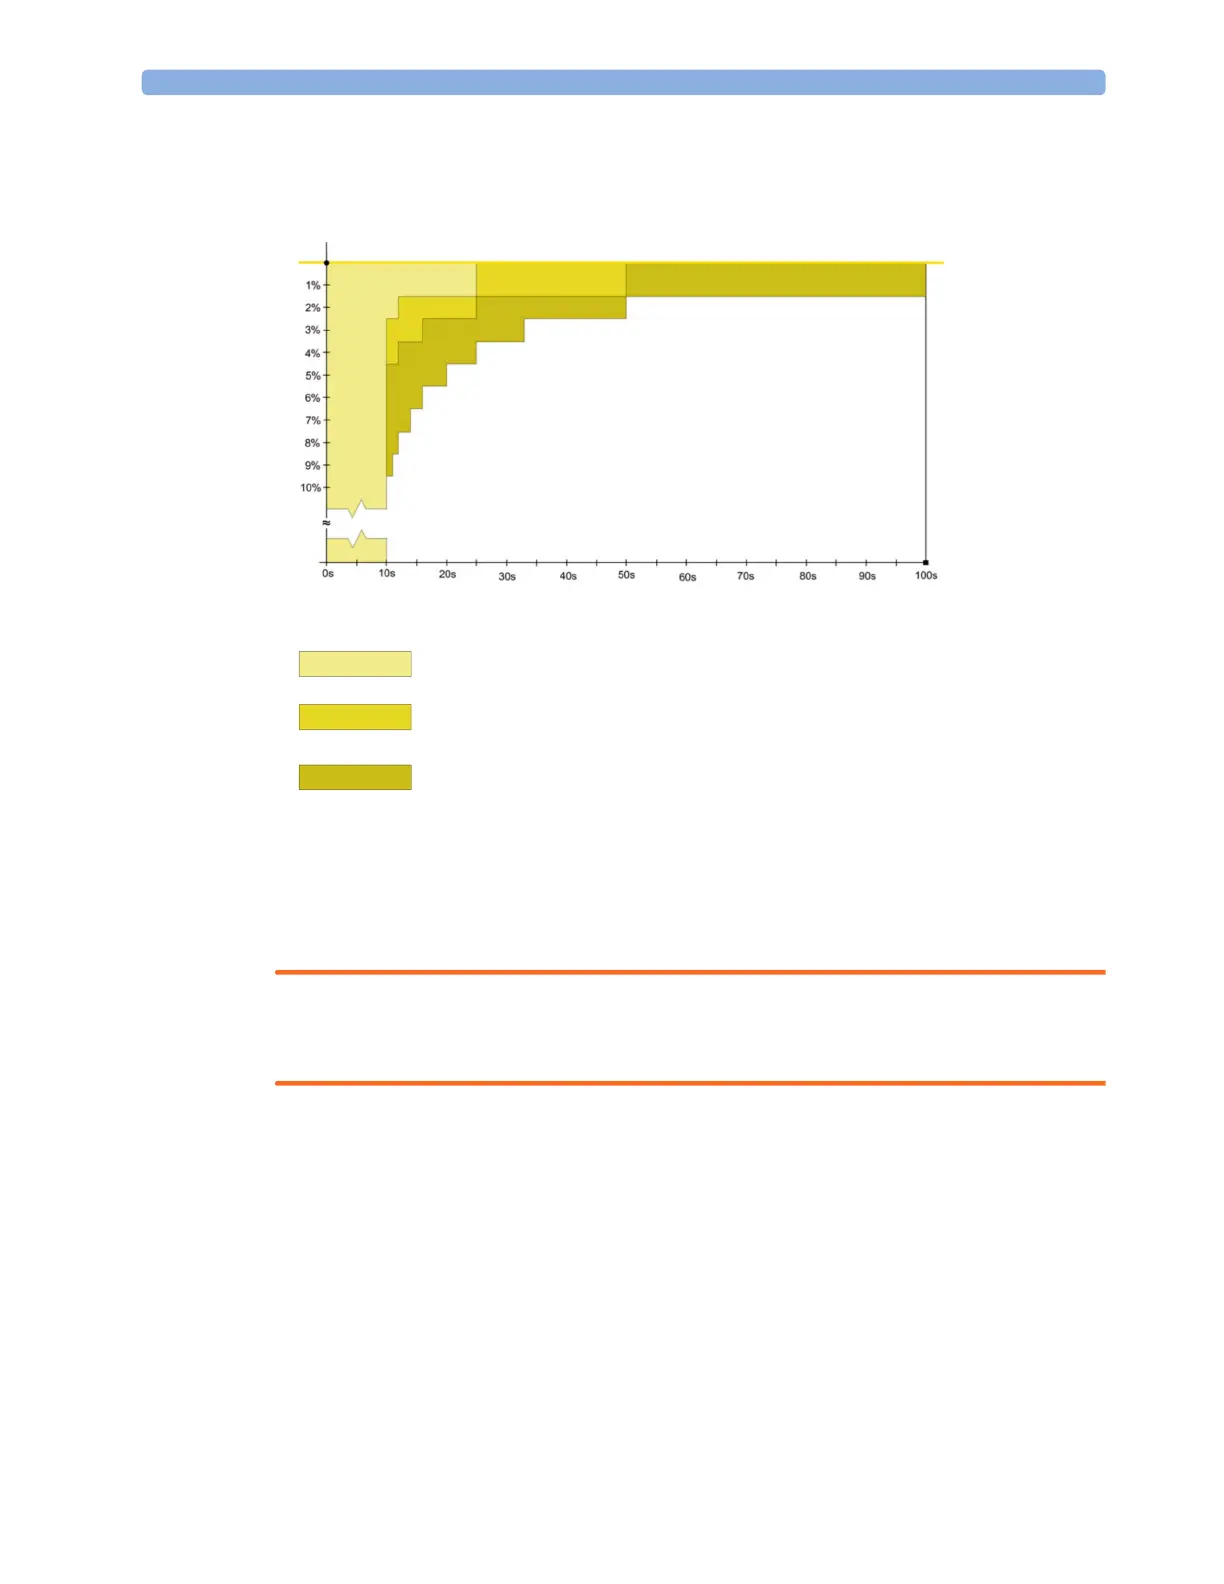
This diagram shows the relationship between the alarm delay and the deviation from the alarm limit.
The shaded areas on the diagram show the area in which SpO
2
values can violate the alarm limit
without causing an alarm to be indicated. The area is smallest for the Short mode, and is extended for
the Medium and Long modes by the corresponding areas shown above.
WARNING
Before using Smart Alarm Delays, make sure that you fully understand how the delay is applied and
what the consequences are.
Alarm Limit
Violation
Deviation
from violated
Alarm Limit
Alarm Limit
Resulting Alarm Delay
Short Mode
Medium
Mode
Long Mode