23 Trends
321
Changing the Selection of Screen Trends Displayed
1 Select the screen trend.
2 Select Change Trend and select the required trend from the list of available trends.
Select
Blank to remove the selected trend from the Screen.
If you do not see
Change Trend in the screen trend menu, the trend is aligned to display with the
measurement wave. Changing the wave automatically changes the trend.
To display two or more screen trends overlapping,
1 Select the screen trend to open the screen trend menu,
2 Select Change Trend followed by Add Trend and select a screen trend from the pop-up list.
Activating the Cursor for Screen Trends
To activate the cursor for Screen Trends:
1 Select the screen trend.
2 Select Activate Cursor.
You can now use the arrow keys to move the cursor across the time line. The values measured at the
cursor time are shown next to the cursor.
To de-activate the cursor,
•Select
Main Screen.
Changing the Screen Trend View
To switch between tabular, graphic, histogram and horizon views, select the screen trend then select
Change View and select the required view.
Tabular View
Aperiodic measurements such as NBP, C.O., C.I., and Wedge can be viewed as a screen trend in
tabular form. The measured values and their timestamps are shown, with the measurement label.
The trend time for tabular screen trends depends on the space available on the Screen. Up to 30
measurements or 12 hours information can be shown.
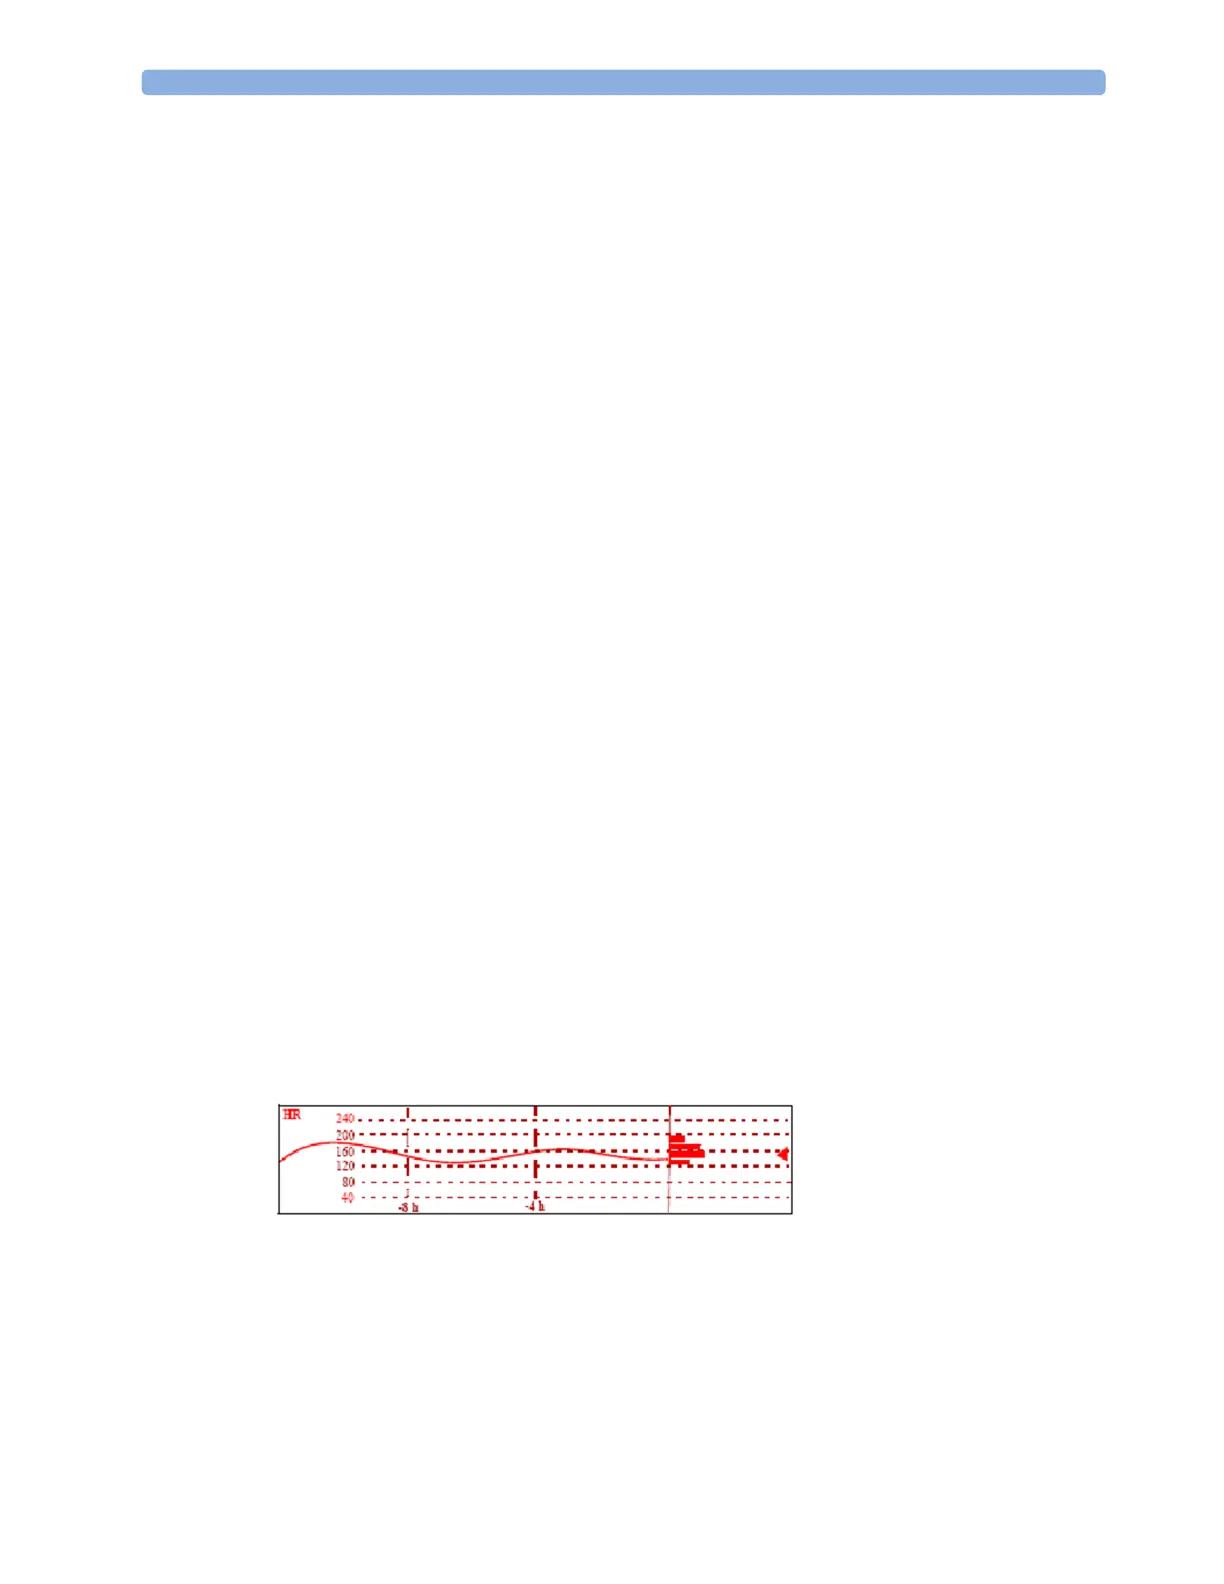
Histogram View
The histogram view presents a combination of graphical trend and histogram. The histogram is on the
right hand side in a horizontal presentation with vertical gridlines representing 25%, 50%, 75% and
100%. Each column shows the percentage of time that the measurement values were in a specific
range. This range is represented by the column's position in the graphical trend gridlines. The arrow
mark next to a column shows that the currently measured value is in the range covered by that column.
If less than two-thirds of the samples are valid, a question mark will be displayed with the histogram,
except when the histogram consists of intermittently measured data.