26 Event Surveillance
342
• To view other event groups, select the pop-up key Review Group and select the group from the
list.
Event Episode Window
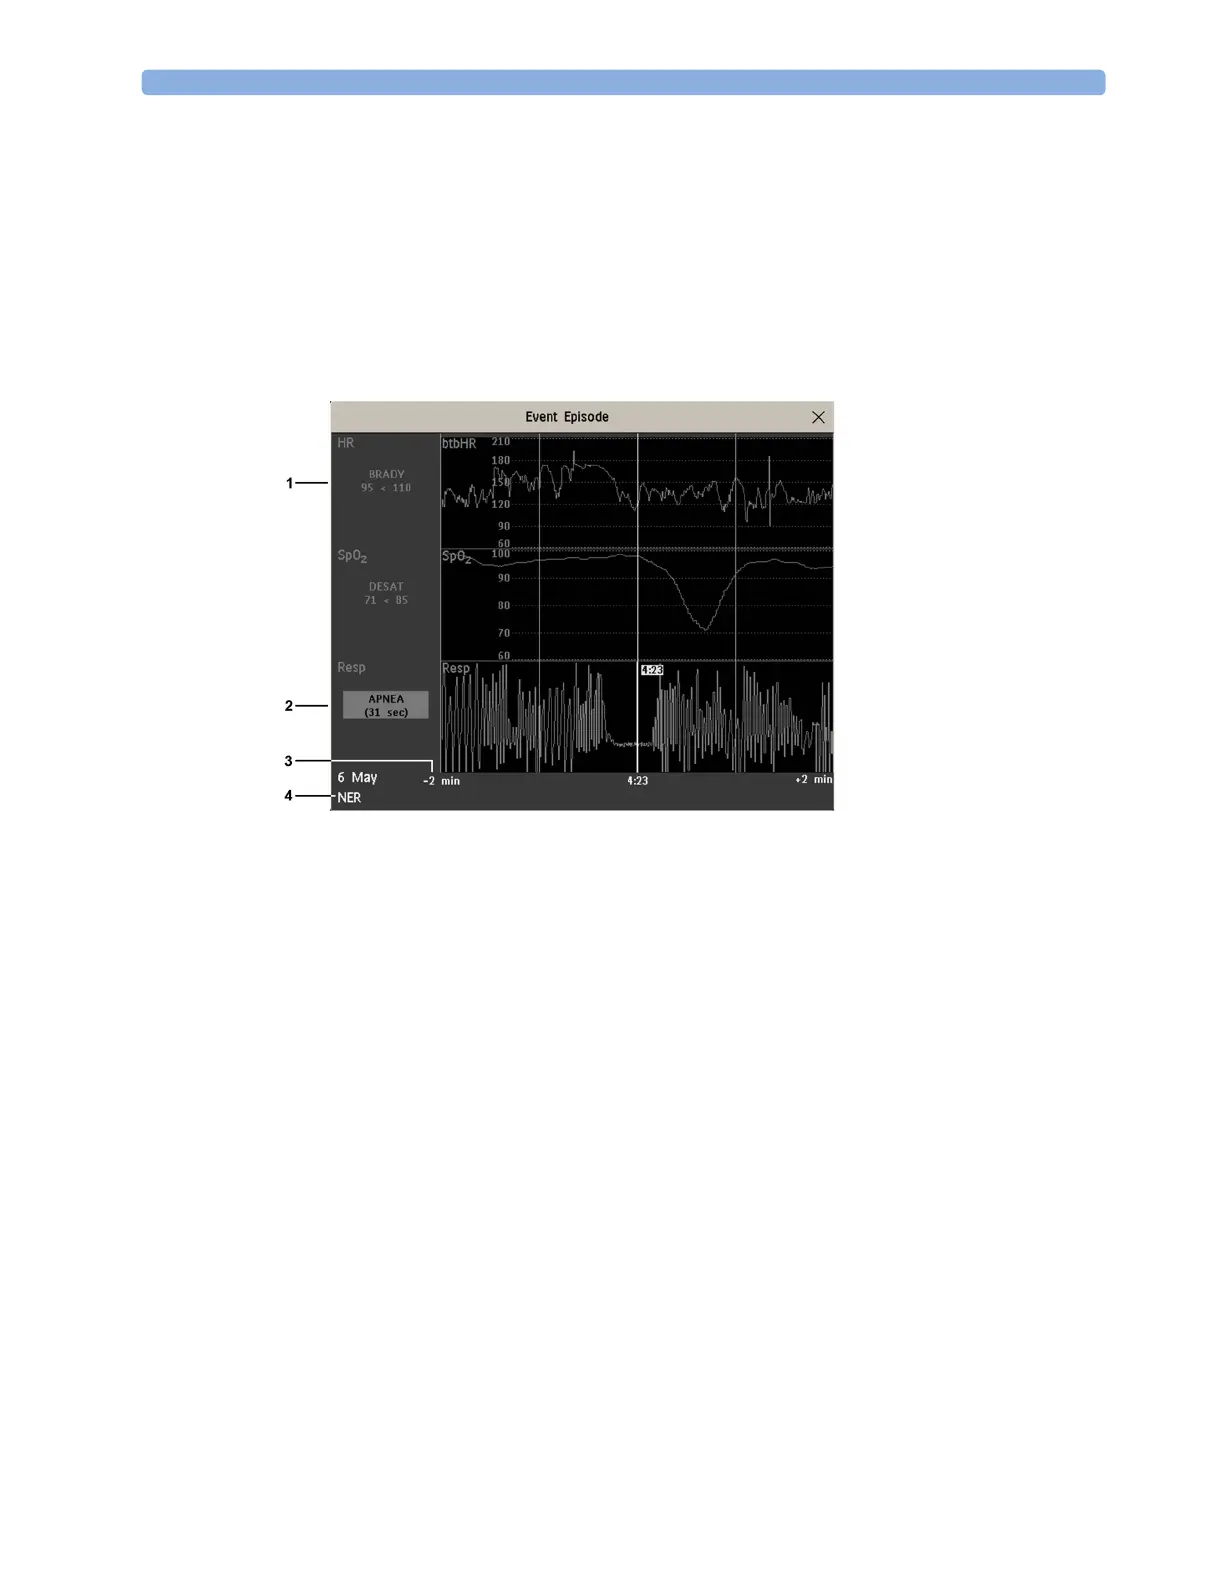
To enter the Event Episode window, select the pop-up key Show Episode.
Depending on the event group settings, the
Event Episode window shows either 20 minutes of
average trend event information, four minutes of high-resolution event information, or 15 seconds of
realtime wave information.
The event values to the left of the measurement channels show the trigger threshold set and the
maximum amount by which this limit was exceeded. In this example, Desat 71<85 tells you that 71
was the lowest SpO
2
value measured during the event time and that the Desat trigger threshold was set
to 85 when the event was triggered. If the event was manually triggered, the event value boxes display
"manual".
Annotating Events
1 To annotate an event, in the Event Episode window, select the pop-up key Select Annotatn.
2 Select the required annotation from the pop-up list of available annotations for the currently active
event group.
Up to 20 annotations can be configured to let you add commonly-used clinical notes to event episodes
for documentation purposes. To see the complete list of available annotations, in the
Event Setup
menu, select
Event Annotation.
Documenting Events
You can print a report or make a recording of the events history stored in the database or of individual
event episodes or a Car Seat Assessment Record.
1 Follow-on event values
2 Trigger event values,
highlighted
3 Timeline, showing
episode Pre/Post-time
4 Active event group