21 Guardian Early Warning Scoring
304
The MEWS score also uses the same color coding and risk levels, which determine the action that
is recommended.
How does MEWS work in Guardian Early Warning Scoring? MEWS results in a subscore
displayed in a circle with the corresponding color, next to each measured or entered value. Actions
are only then recommended when all required vitals have been measured or entered, and
the MEWS score has been calculated. The content of the action list depends upon the risk band
severity the MEWS score falls into. For each risk band severity (Normal, Observe - at risk,
Warning and Urgent) a separate action list can be configured.
Which Type of Scoring is Being Used?
The type of scoring used in your department, whether it is SPS or MEWS, or a combination of both,
was configured during your system setup. Normally, the configuration is based on an assessment
method already in use before the system was set up. Which vitals are needed for scoring, and which
actions are recommended for specific scores or risk bands, was also configured individually.
Independent of the type of scoring used, there may be additional vital signs or clinical observations
which are configured to be included in the entry screen. They do not contribute to scoring but are
included in the SpotCheck record.
Viewing EWS Trend Data
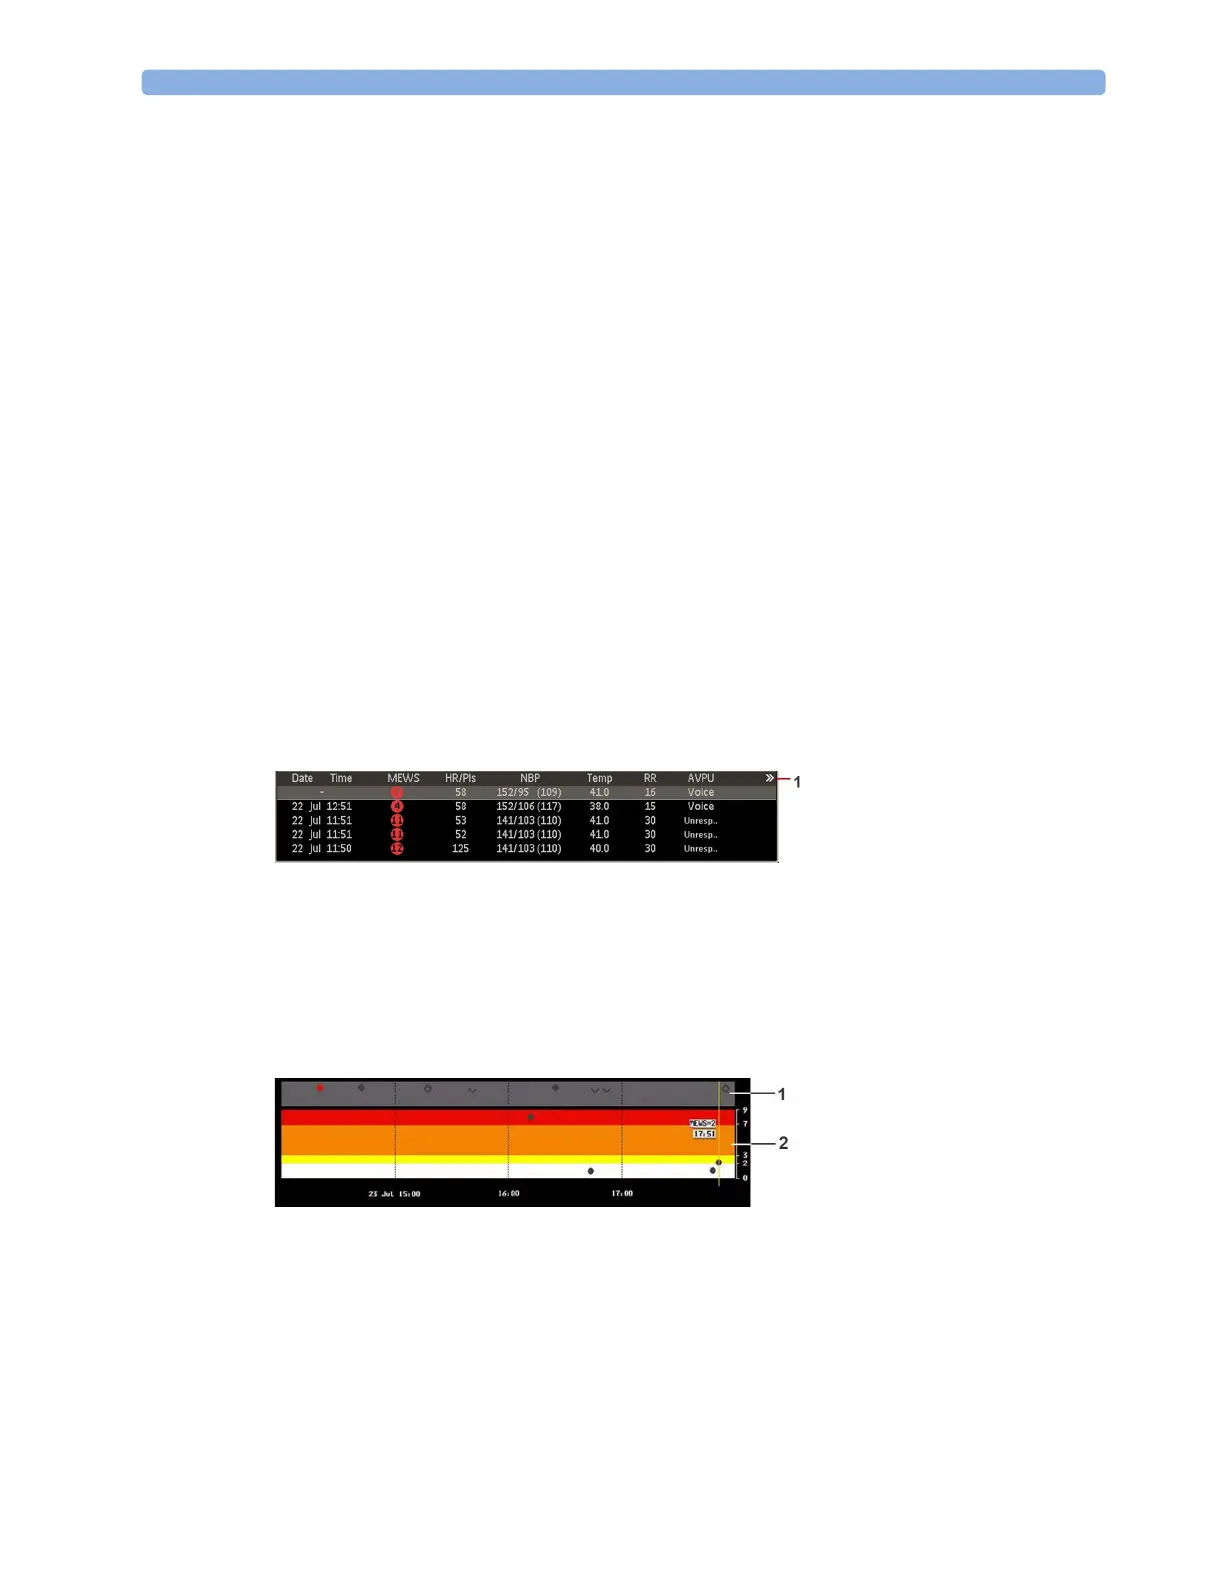
To view trend data, select the SpotChk Trend SmartKey. A tabular trend will be shown, with all
measured and entered data and any calculated scores. You can use the up arrow and down arrow keys
to scroll through the list of Spot Check records.
1 This symbol indicates that more information is available than can be shown on the Screen. Select
the tabular trend to page through the remaining data columns.
Select the
Graph/ Tabular pop-up key to view the data in graphical form. If any MEWS records are
present, they will be displayed in the color-coded risk bands (2) in the lower half of the graphical trend.
The MEWS score ranges corresponding to the colored bands are shown in the scale on the right.
Other record types, such as SPS, are displayed in the notification area (1). The symbols used are
explained in “Symbols Used in the Trend Views” on page 305.
Select the
Detailed View pop-up key to see a combined graphical/tabular view for the currently
highlighted record. Use the cursor keys (right arrow and left arrow) to move from one record to the
next. The detailed data are shown above the graphical trend, with units and the corresponding SPS or
MEWS symbols. In the example below:
1 Colored circle for SPS data
2 MEWS score symbol (color coded according to the risk level)
3 MEWS subscore symbol (color coded according to the risk level)