Charts ECDIS-E User Guide
4-22 65934012
To display only the charts from a specific database click on the Database
drop down arrow and select from the list. The table is re-drawn showing
only those charts assigned to that database.
Chart Outlines
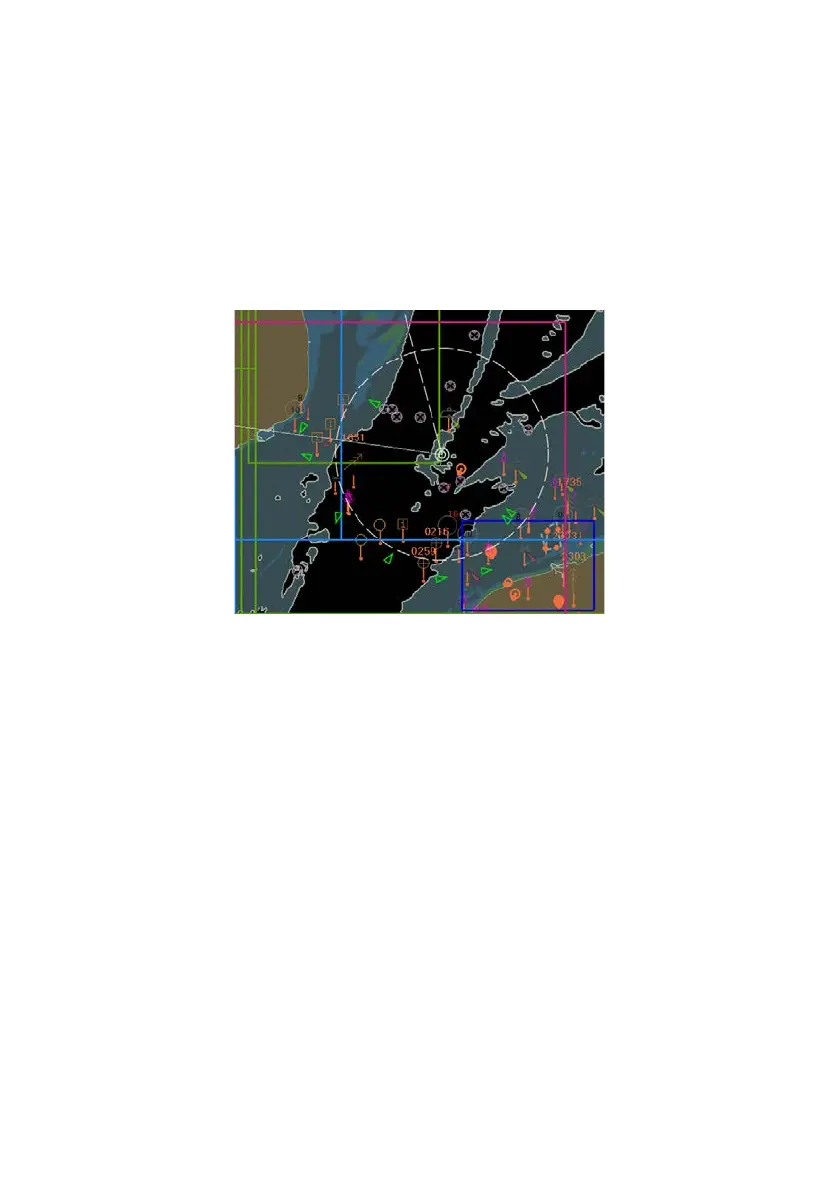
To display chart outlines, tick the Draw Chart Outlines check box. The
display will show the coverage of the charts within the current display area
as a series of coloured chart boundary rectangles, the colour of the chart
boundary is dependent on the chart usage level.
Chart Selection
Individual charts may be located and identified on the chart display. To
select a chart tick the Chart Selection Cursor check box and move the
cursor to the chart display, the letters SEL are added to the cursor. Note
that the chart selection cursor is temporary, after a period of 10 to 15
seconds the cursor reverts to normal and the check box goes back to
unticked.
Click in an area of the chart display. The outline of the chart is drawn and
its area displayed in colour (the colour of the outline and area is dependent
on the chart's usage level). The chart is also highlighted in the Index list.


 To Next Page