9-20
Agilent 7500 ICP-MS ChemStation Operator’s Manual
Viewing Spectra
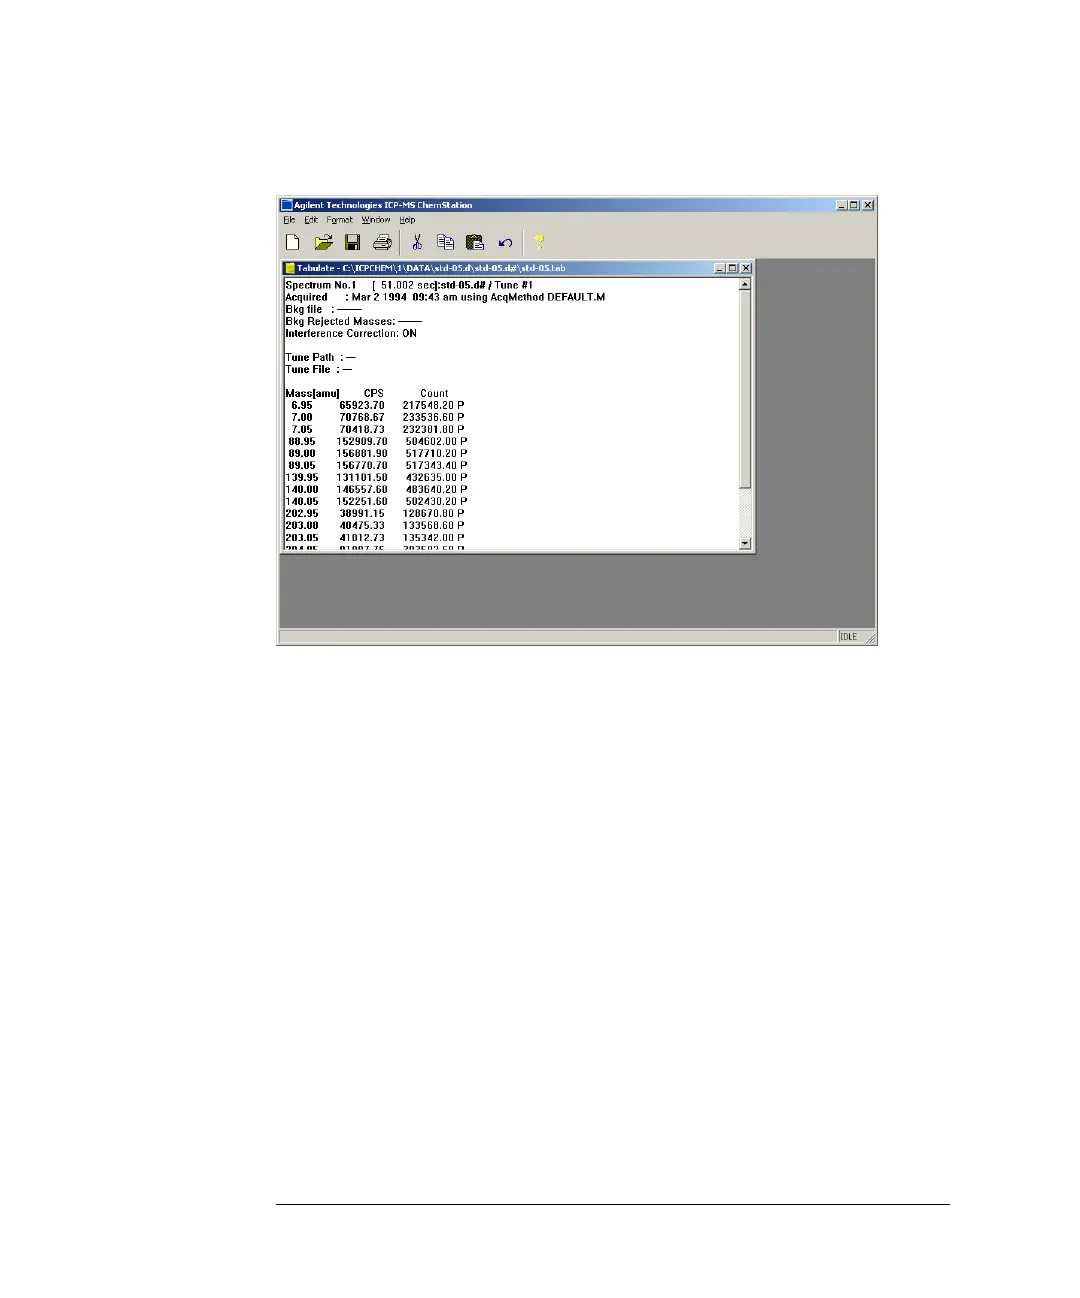
Points per Peak Tabulation
The tabulation provides information about the mass, counts per second (CPS),
count, and detector mode for each point per peak of each element analyzed. The
amount of information contained in the tabulation depends on the peak pattern set
and number of elements selected in the method. For example, if you use a method
with a peak pattern of three points per peak, the tabulation contains information
about three masses for each selected mass. Thus tabulation might contain informa-
tion for Li (mass 7) at the following three masses: 6.95, 7.00, and 7.05. The sum of
the abundance for these three masses is equal to the counts detected for the nominal
mass, as displayed on the mass tabulation (see below) or on the quantitative report.
To print out the tabulation, select File
>>Print.
When you are finished working with the file, select File
>>Exit.

 Loading...