10-23
Agilent 7500 ICP-MS ChemStation Operator’s Manual
Viewing a Time Chart
Integrating Results
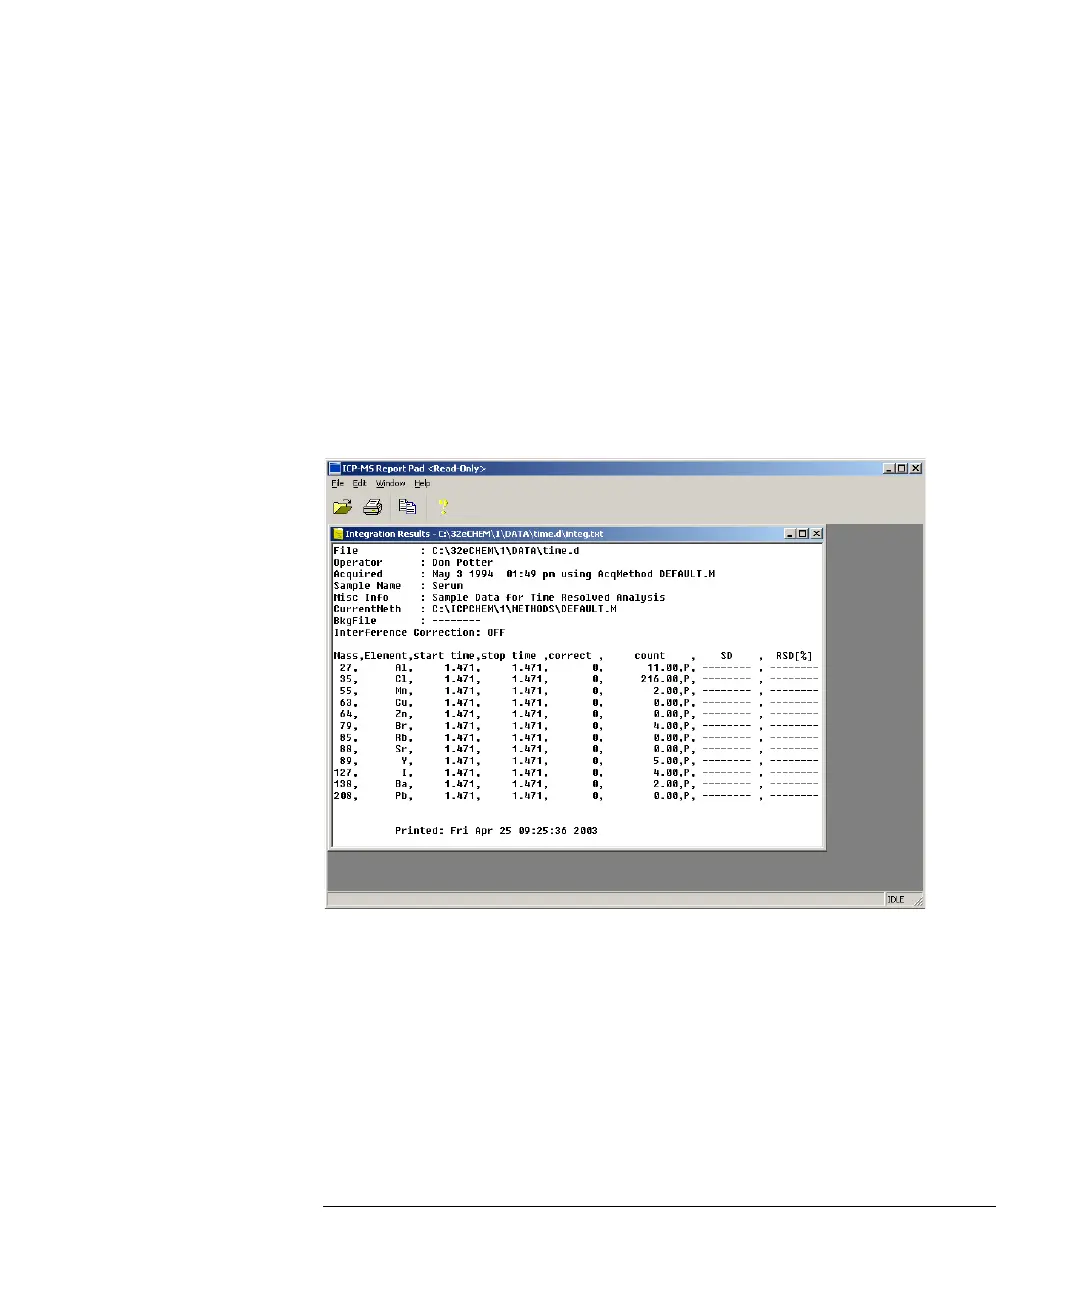
Integrating the total ion or extracted ion chart gives total area counts for all the inte-
gration windows selected. To integrate results for elements in a sample, complete
the following steps:
1 Select Data Analysis>>Main Panel.
The ICP-MS Data Analysis window appears.
2 Select FullQuant
>>Integration Results.
The Report Pad - INTEG.TXT file appears, showing the results for all elements for a
selected part of the acquisition period.
Integration Results File
When the method or sequence runs and the Quantitation Report is selected in the
Data Analysis, the quantitative results will be automatically reported.
For more information about creating the calibration curve and the Quantitation
Report, see chapter 12, “Performing a Quantiative Analysis”.

 Loading...