10-20
Agilent 7500 ICP-MS ChemStation Operator’s Manual
Viewing a Time Chart
Analyzing Results Using a Time Chart
ChemStation enables you to define integration parameters for the peaks in a sample
and to integrate them to obtain concentration values. You can use these two features
to examine the data acquired with a method for Time Resolved Analysis or Time
Program acquisition.
The following sections explain how to select integration parameters and integrate
peaks in a sample.
Defining Integration Windows
Before you can integrate the peaks in a sample, you must define an integration win-
dow. Integrating peaks in a plot gives the intensity of that peak and therefore an indi-
cation of the concentration of that component.
Ensure that you have extracted ion charts showing in the display window. To set the
integration window, complete the following steps:
1 Drag across a section of the Extracted Ion Chart using the right mouse button.
The section is highlighted.
2 Release the mouse button.
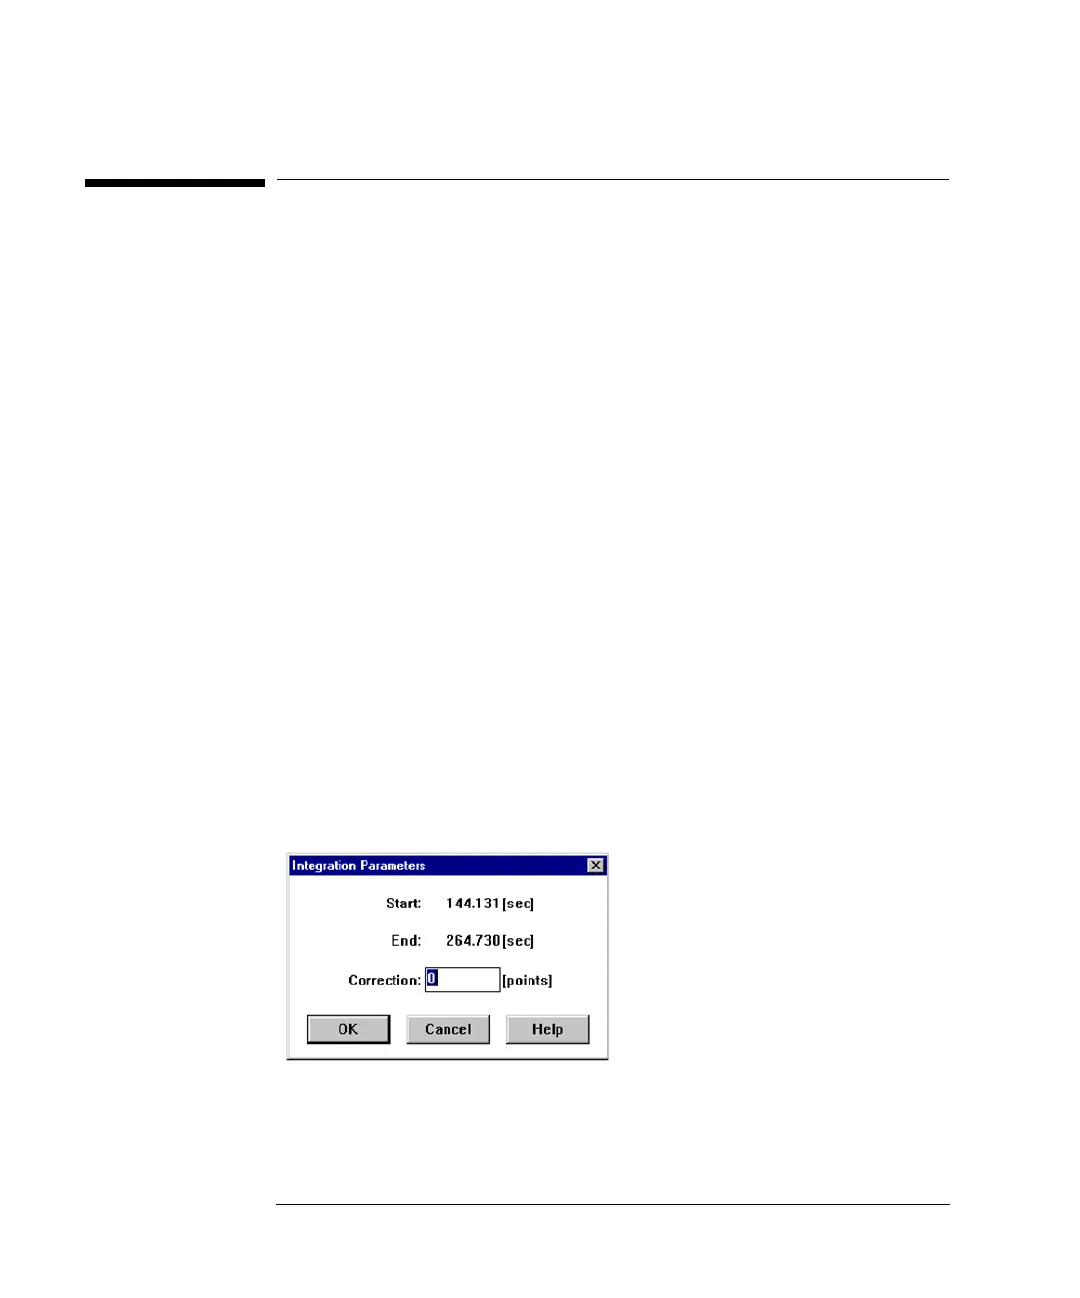
The Integration Parameters dialog box appears.
Integration Parameters Dialog Box 1
The start and end times shown in the dialog box are the beginning and end points of
the section you highlighted in Step 1.

 Loading...