10-16
Agilent 7500 ICP-MS ChemStation Operator’s Manual
Viewing a Time Chart
Labeling a Time Chart
You may want to label the Total Ion Chart created by integrating results for elements
in a sample. You can also label an Extracted Ion Chart. ChemStation enables you to
name or add identifying information to a time chart prior to printing.
To label a time chart, complete the following steps:
1 Ensure that a time chart displays in the ICP-MS Data Analysis window.
If the ICP-MS Data Analysis window displays a spectrum, you must load the appro-
priate data file. For more information, see “Loading a Data File” in this chapter
2 Place the cursor exactly where you want the label to appear.
Note both the horizontal and vertical placement of the cursor.
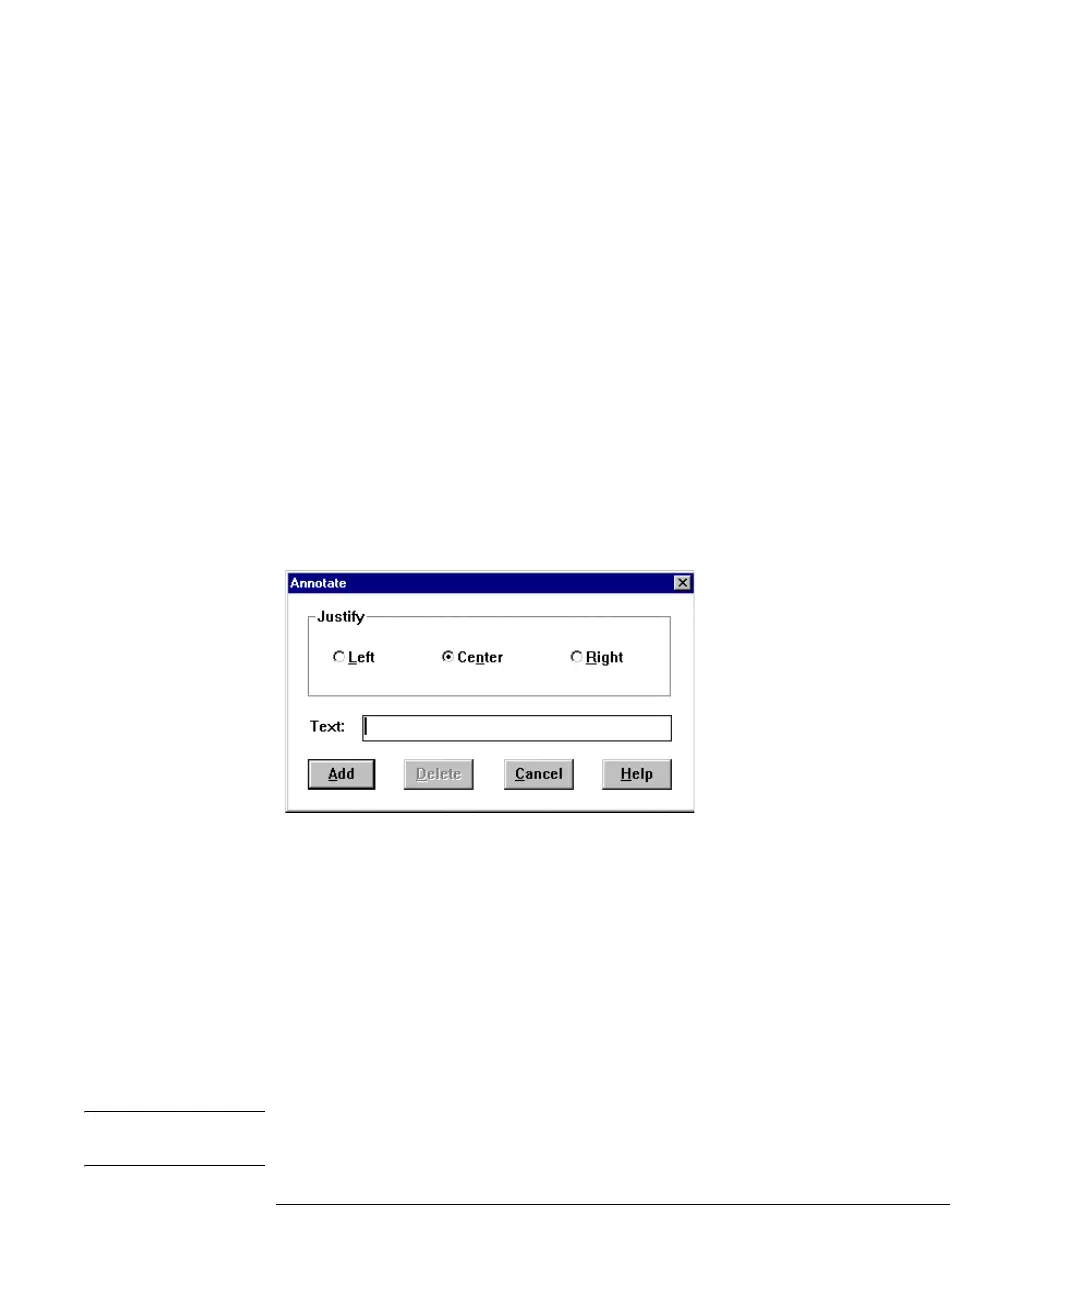
3 Click both mouse buttons at the same time.
The Annotate dialog box appears.
Annotate Dialog Box
4 Click the Left, Center, or Right Justify button.
The label will appear to the left, center, or right of the location you specified in
Step2.
5 Type a name or other identifying information in the text box.
6Click Add.
ChemStation returns to the time chart, and the information you typed appears at the
location of the cursor.
NOTE You can change and delete the text by clicking exactly on top of the previously
labeled point, rewriting the text, then clicking Update in the Annotate dialog box.

 Loading...