12-18
Agilent 7500 ICP-MS ChemStation Operator’s Manual
Performing a Quantitative Analysis
VIS correction formula
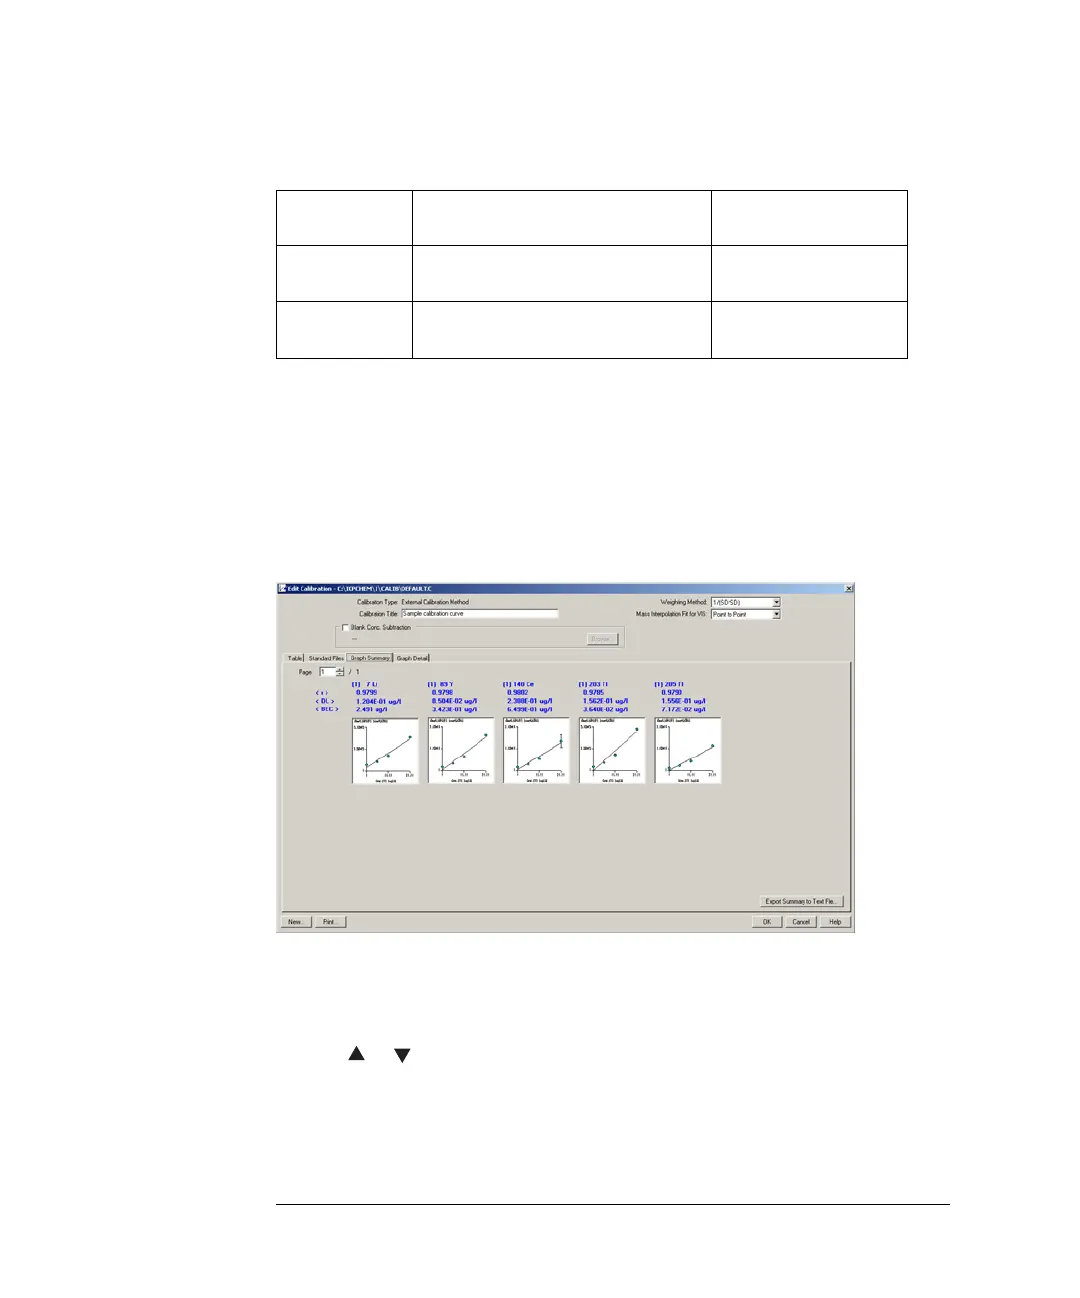
Confirming the Graph Summary
The Graph Summary tab screen permits checking of the correlation coefficient
factor (r), DL, and BEC (background-equivalent concentration) of all elements for
the calibration set on the Table tab screen.
1 Select the Graph Summary tab in the Edit Calibration dialog box.
The Graph Summary dialog box will appear.
Graph Summary Dialog Box
If there are too many elements to fit on one page, they will be displayed on two or
more pages. Up to 12 elements can be shown on one page. You can move to the next
or previous page by entering a numeric value directly into the Page list box or
clicking or .
The title of each element shows the (tune step number), mass, and element symbol,
as well as the correlation coefficient factor (r), DL, BEC (background-equivalent
concentration), and calibration curve.
Point-to-Point Linear interpolation (no extrapolation)
applied to data of two VIS elements
One or more VIS
elements required
Linear Linear formula obtained based on data
of all VIS elements
Two or more VIS
elements required
Quadratic Quadratic formula obtained based on
data of all VIS elements
Three or more VIS
elements required

 Loading...