10-17
Agilent 7500 ICP-MS ChemStation Operator’s Manual
Viewing a Time Chart
NOTE Exiting the Data Analysis window or loading the another file erases the annotation.
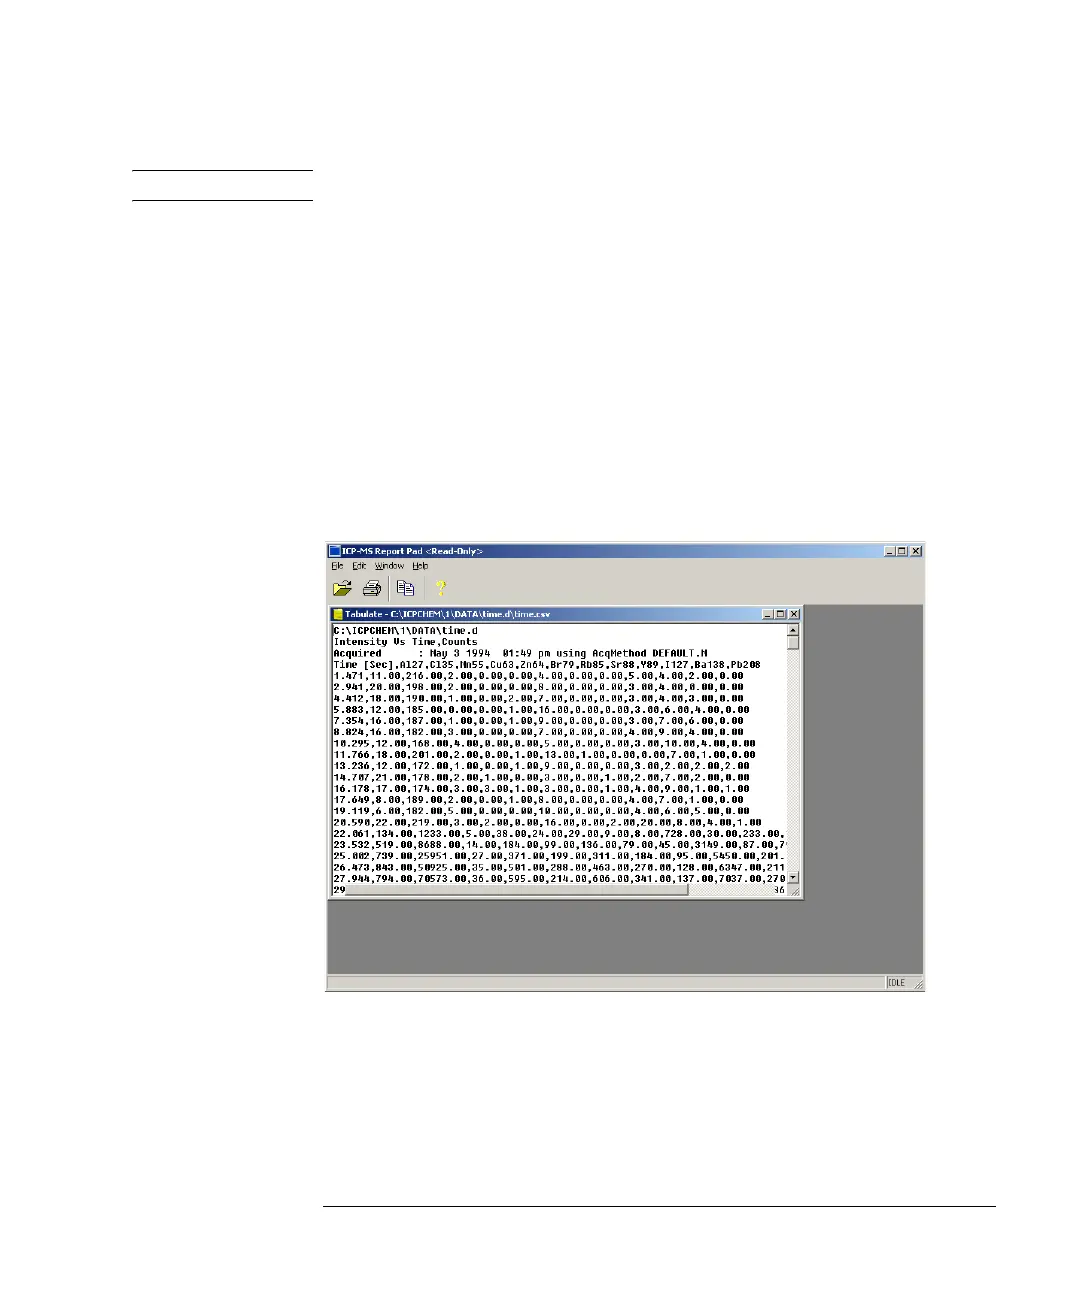
Display of Data at Points of Time
During data analysis, data acquired at specific points of time can be displayed.
Follow the procedure described below.
1 Choose Tabulate Chart Raw Data to CSV or Tabulate Chart CPS Data to CSV in
the Data File menu.
• Tabulate Chart Raw Data to CSV: Displays the time-resolved analysis raw data
(counts).
• Tabulate Chart CPS Data to CSV: Displays the time-resolved analysis CPS data.
Raw Data

 Loading...