13-14
Agilent 7500 ICP-MS ChemStation Operator’s Manual
Performing a Semiquantitative Analysis
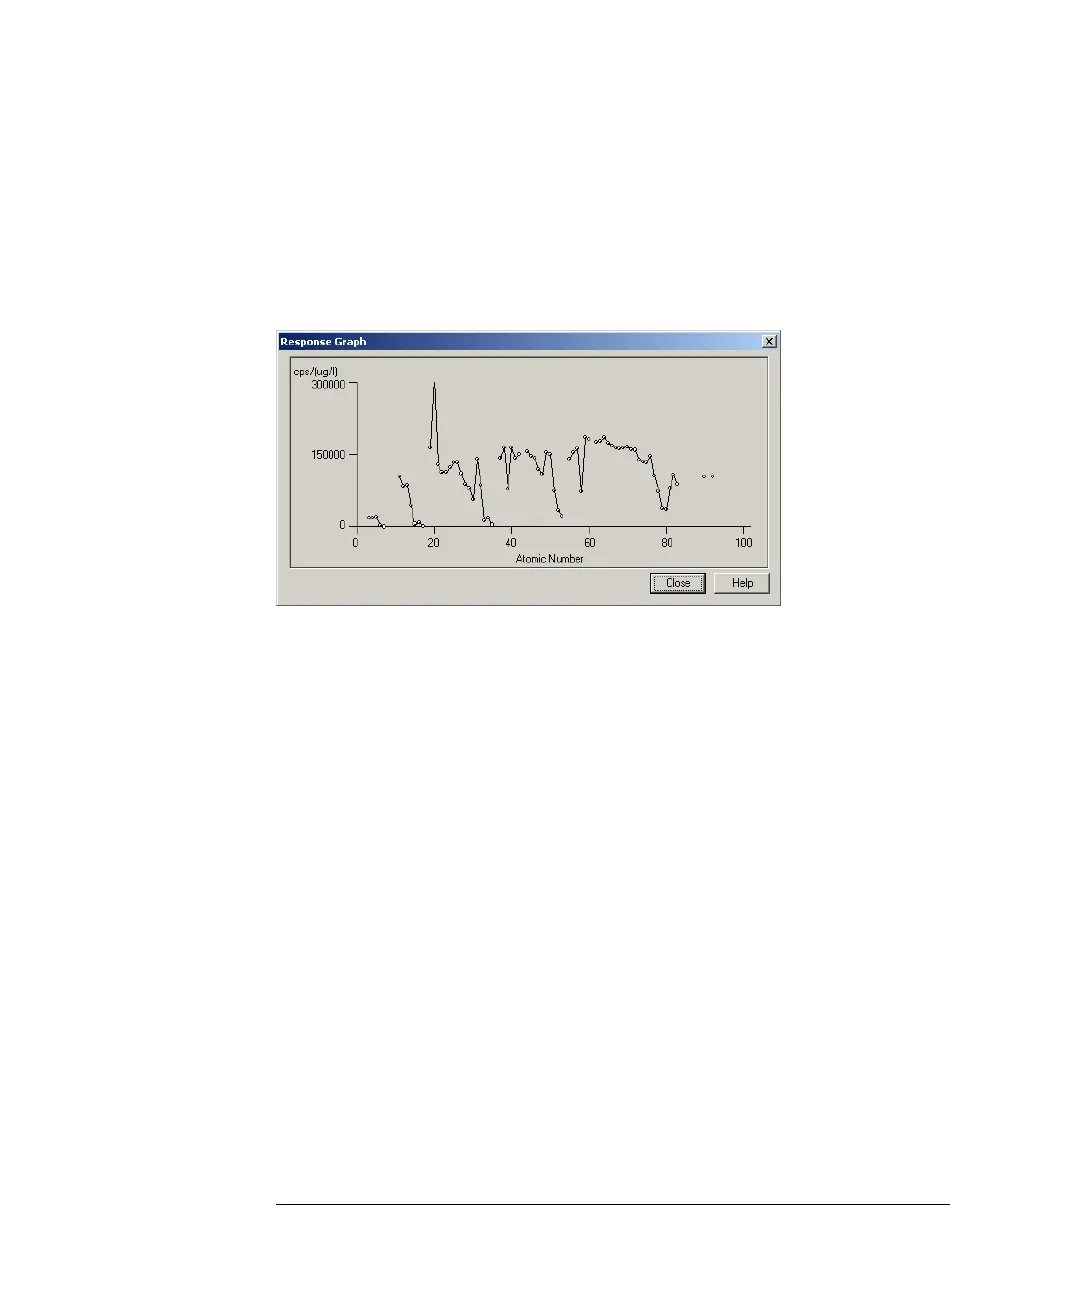
Viewing the Response Graph
After you correct responses for all elements, you can view a graph of those
responses. To do so, complete the following steps:
1Click Response Graph.
The Response Graph dialog box appears.
Response Graph Dialog Box
The scale for the X-axis of the graph is 0 to 103 and shows responses for each
element by atomic number. The Y-axis shows the counts per second (cps).
2 To close the dialog box, click OK.
ChemStation returns to the SemiQuant Parameters dialog box

 Loading...