EasyManuals Logo

Agilent Technologies 7500 ICP-MS User Manual

Agilent Technologies 7500 ICP-MS
659 pages
To Next Page IconTo Next Page
To Previous Page IconTo Previous Page
Page #421 background imageLoading...
Page #421 background image
11-9
Agilent 7500 ICP-MS ChemStation Operator’s Manual
Creating Custom Reports/Database
Adding a Chart to a Custom Report
You can add a chart of the current data file to a custom report. To add a spectrum
chart, Time chart, Ion Chart, or Calibration curve, complete the following steps:
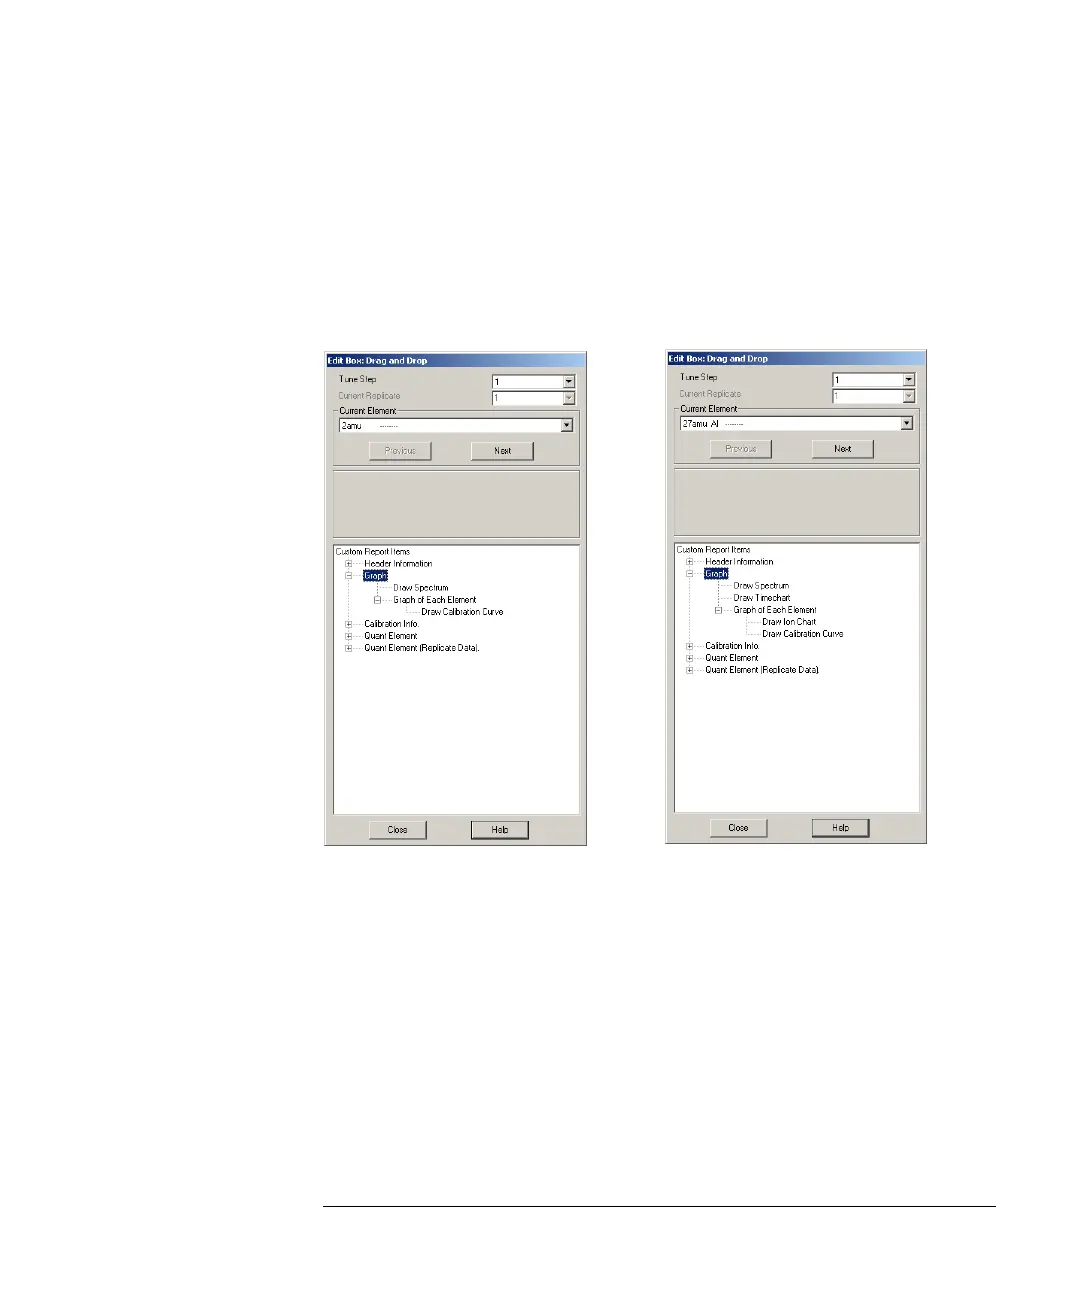
1 Select View>>Edit Box.
The Edit Box dialog box appears. The displayed information in the Edit box depends on the
data type (Spectrum or Time chart).
Spectrum Time chart
Edit Box Dialog Box

Table of Contents

Questions and Answers:

Question and Answer IconNeed help?

Do you have a question about the Agilent Technologies 7500 ICP-MS and is the answer not in the manual?

Agilent Technologies 7500 ICP-MS Specifications

General IconGeneral
BrandAgilent Technologies
Model7500 ICP-MS
CategoryLaboratory Equipment
LanguageEnglish

Related product manuals