11-10
Agilent 7500 ICP-MS ChemStation Operator’s Manual
Creating Custom Reports/Database
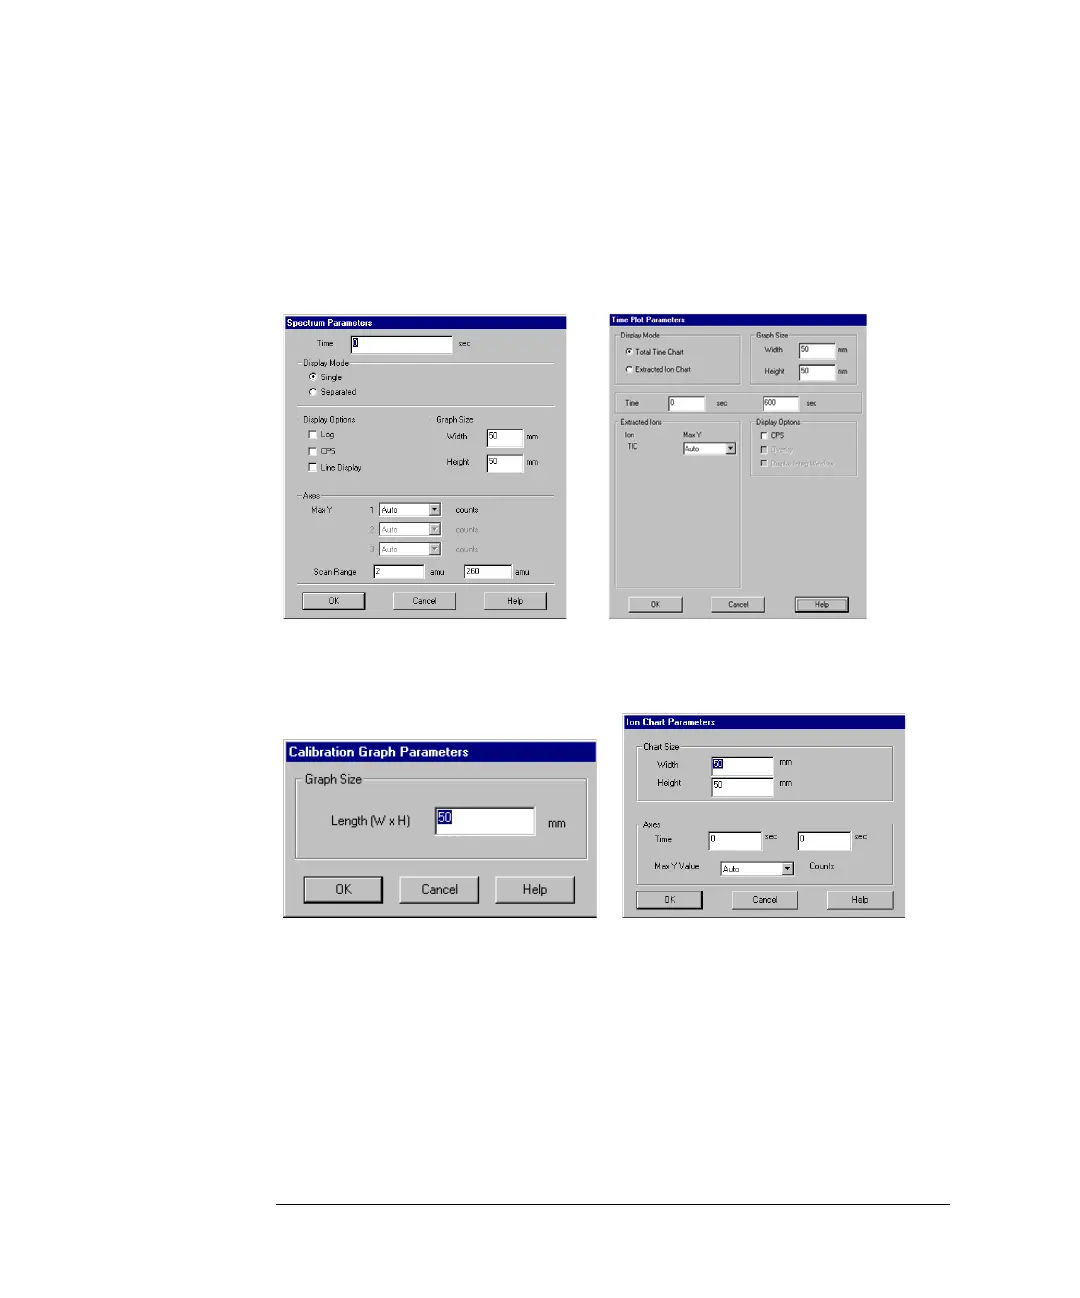
2 Select Draw Spectrum (or Draw Timechart) under the Graph tree, and drag and
drop it to the desired position on the custom report. Or select Draw Ion Chart
(or Draw Calibration Curve) under the Graph tree, and drag and drop it to the
desired position on the custom report.
The following dialog box appears.
Spectrum Parameters Dialog Box Time Plot Parameters Dialog Box
Calibration Graph Parameters Dialog Ion Chart Parameters Dialog Box
Box
3 Select the desired options.
This dialog box allows you to manipulate how the chart will look.
(The Time box in the Spectrum Parameters dialog box is for Time Resolved
Analysis data).

 Loading...