EasyManuals Logo

Agilent Technologies 7500 ICP-MS User Manual

Agilent Technologies 7500 ICP-MS
659 pages
To Next Page IconTo Next Page
To Previous Page IconTo Previous Page
Page #387 background imageLoading...
Page #387 background image
9-33
Agilent 7500 ICP-MS ChemStation Operator’s Manual
Viewing Spectra
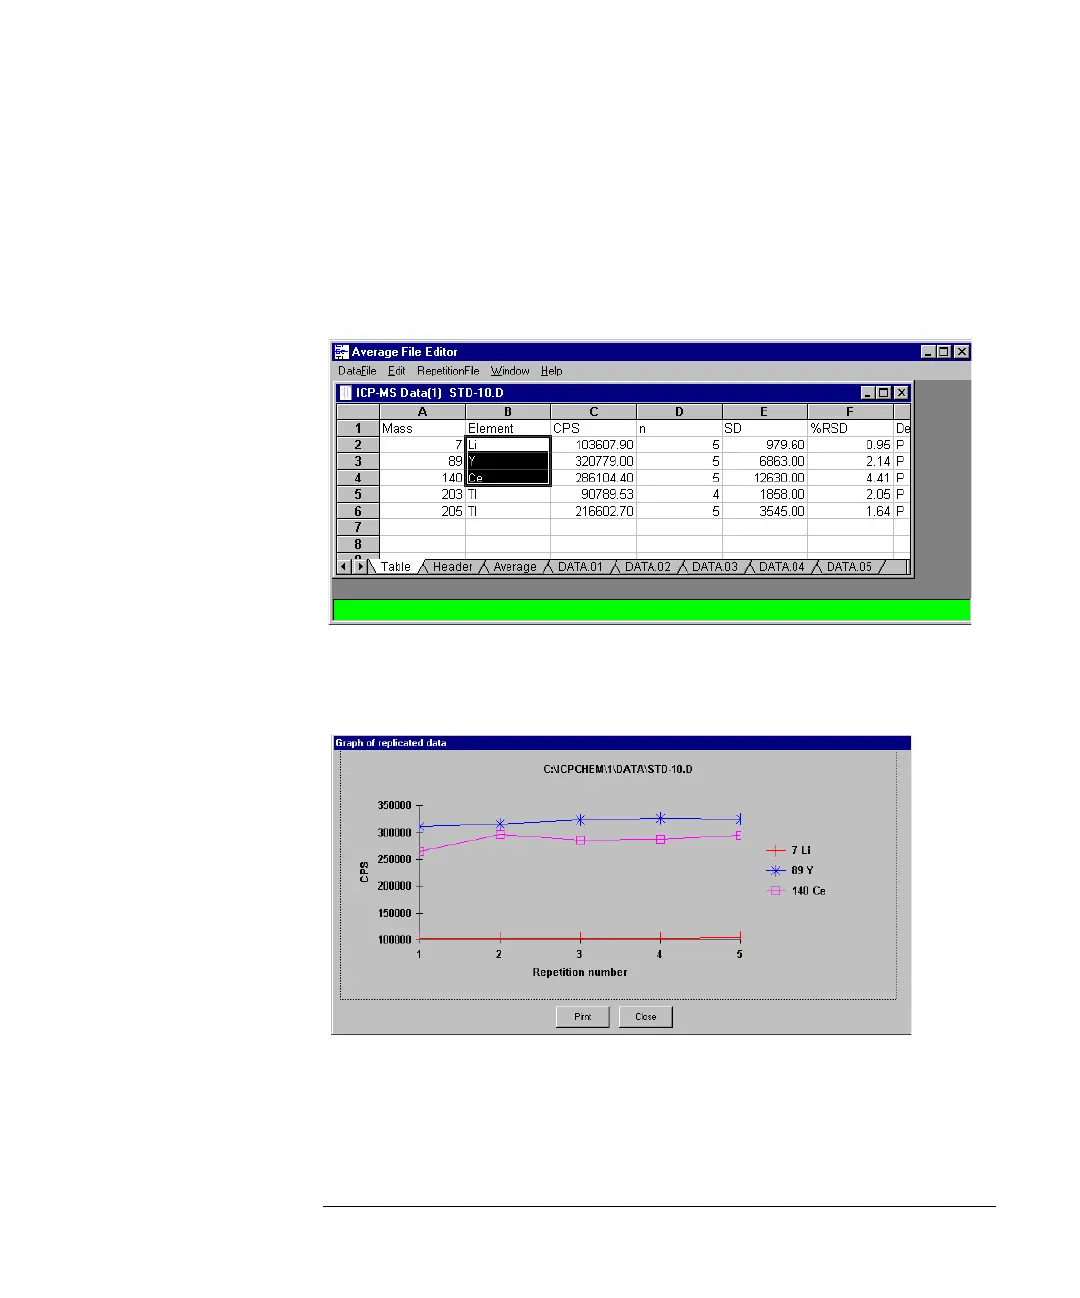
Drawing a Graph from the Tabulated Information
Once you have tabulated the spectral information, you can draw a graph for the ele-
ments of interest.
To draw a graph for the elements of interest, complete the following steps:
1 Select the cells for elements of interest in the Table work sheet.
2 Select Edit>>Graph.
The graph is automatically drawn.
Graph of replicated data
You can print the graph by clicking on Print.

Table of Contents

Questions and Answers:

Question and Answer IconNeed help?

Do you have a question about the Agilent Technologies 7500 ICP-MS and is the answer not in the manual?

Agilent Technologies 7500 ICP-MS Specifications

General IconGeneral
BrandAgilent Technologies
Model7500 ICP-MS
CategoryLaboratory Equipment
LanguageEnglish

Related product manuals