12-21
Agilent 7500 ICP-MS ChemStation Operator’s Manual
Performing a Quantitative Analysis
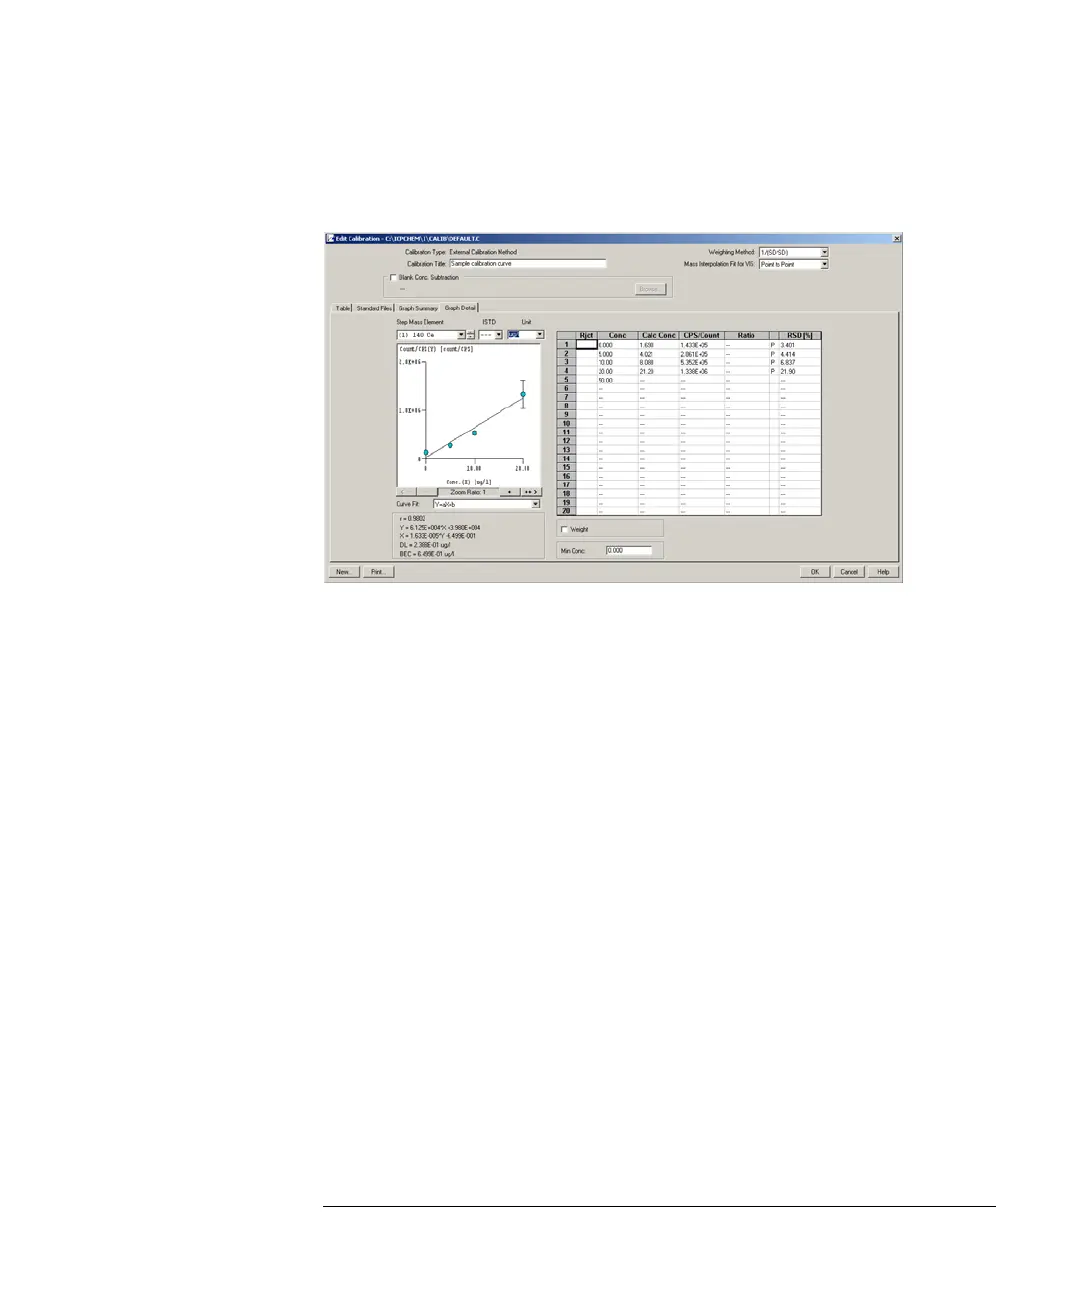
1 Select the Graph Detail tab in the Edit Calibration dialog box.
The Graph Detail dialog box will appear.
Graph Detail Dialog Box
The left side of the dialog box shows the calibration information and a calibration
curve. Clicking [-] will zoom out and clicking [+] will zoom in. Clicking [<--] will
reset the zoom and clicking [++>] results in maximum zoom.
The table on the right side shows the concentration, calculated concentration value,
CPS or count, strength ratio (if internal standard correction is used), and detector
mode (P or A) for each level, as well as the RSD table for the element at each
calibration level.
2 To check a point of a level on the calibration curve, perform the following
procedure.
1) Select a line in the table on the right side.
The selected line will be highlighted and a circle will appear around a point on the
graph.
The color of the point on the calibration curve provides an indicator as follows: light
blue for pulse mode and green for analog mode.
2) To reject a point on the calibration curve, double-click on the Rjct field. The
Reject field will show “*.”

 Loading...