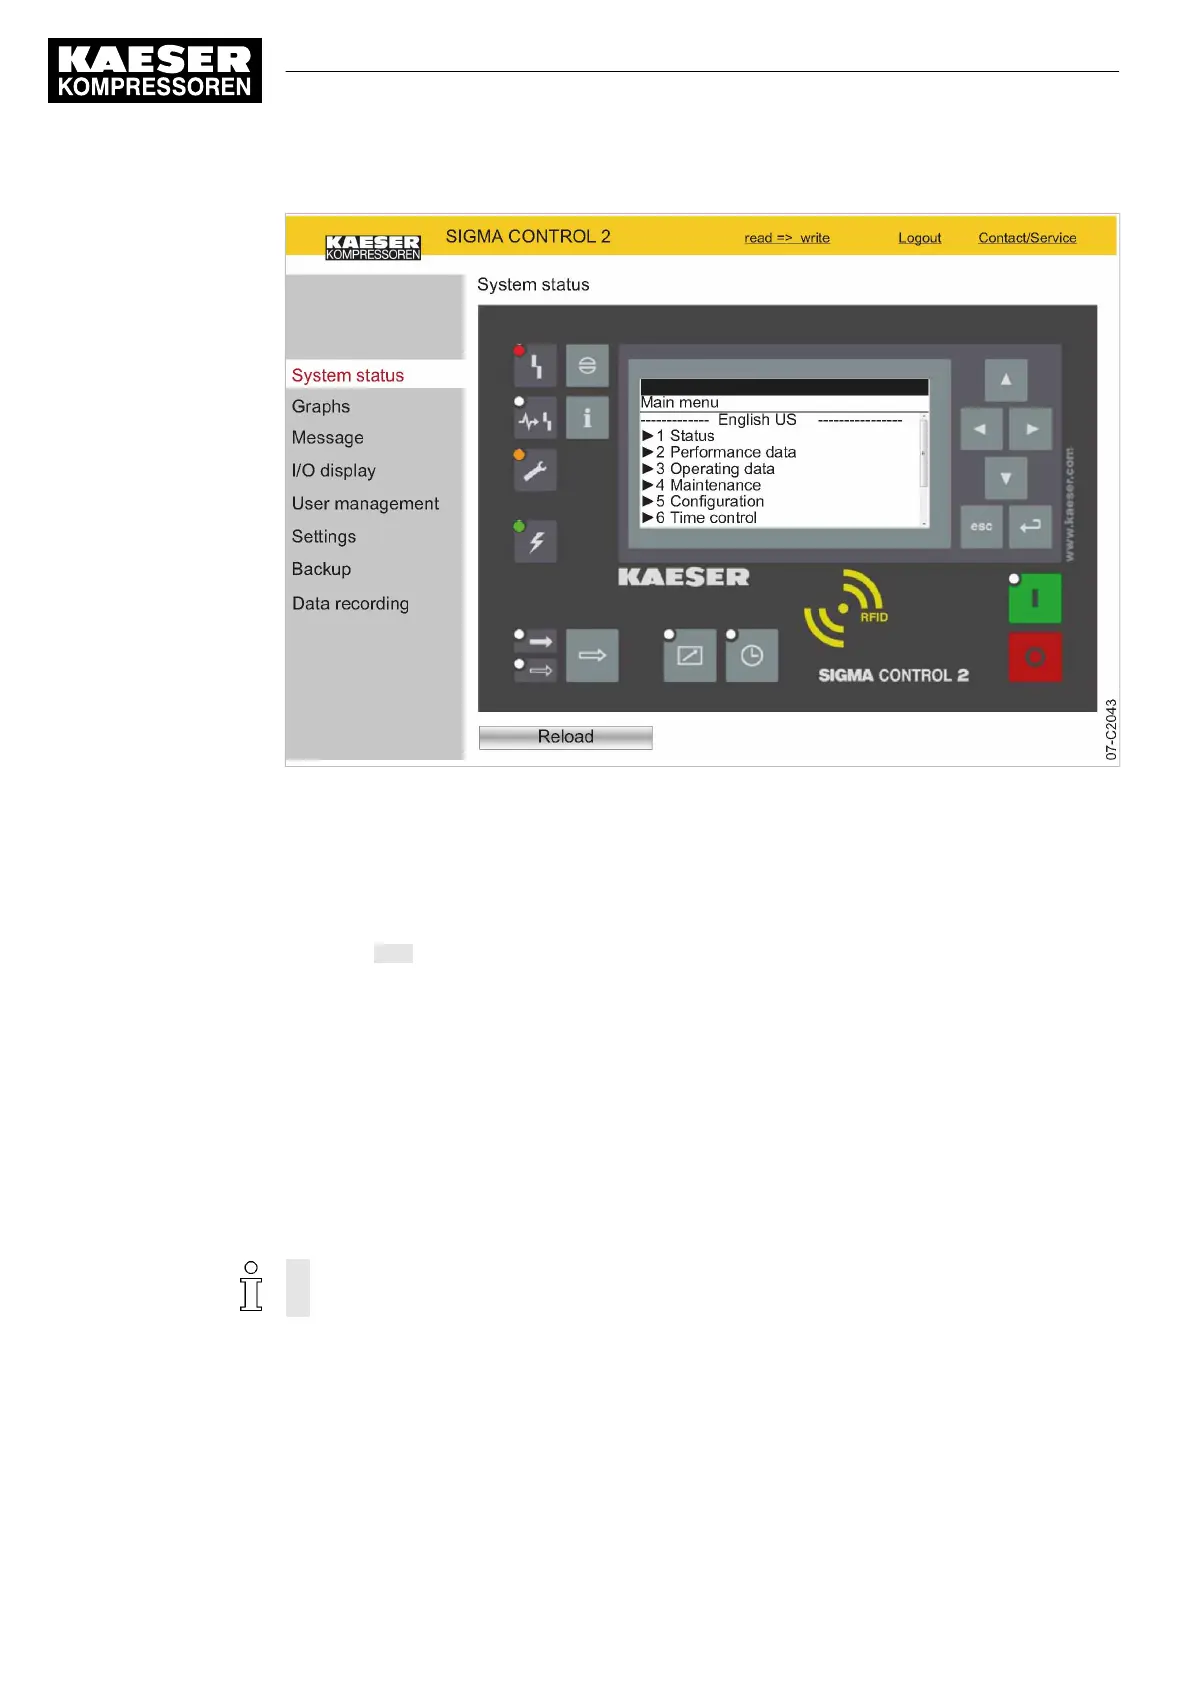
Fig. 19 Main menu
2. Click in the SIGMA CONTROL 2 display.
The Main menu is displayed.
3. Click the numbered lines.
The system displays the corresponding submenus.
4. Press ESC repeatedly to leave this menu.
8.3.3 Graphs menu
When starting the
Graphs
menu, the recorded data from the last 60 minutes are loaded. The last
20 minutes are displayed in a graph. The system updates the graph every ten seconds whilst the
current time is displayed.
If an SD card is provided in the X5 SD card slot, you can retrieve and display the automatically-
recorded machine data for any time in the past.
Moving the mouse pointer across the graph calls up a ruler. The time selected with the ruler and
the associated values are displayed in the legend above the graph. When the ruler is hidden, the
time and associated values are displayed at the right edge of the graph.
The graph content depends on the machine type.
The
Speed
display is implemented only for machines with frequency converter.
Precondition KAESER CONNECT for SIGMA CONTROL 2 is displayed.
1. Click the
Graphs
menu element.
8 Initial Start-up
8.3 Using KAESER CONNECT
76
User Manual Controller
SIGMA CONTROL 2 SCREW FLUID ≥5.1.2 No.: 9_9450 13 USE