Chapter 11 Monitoring
11-81
Notes
a. The max./min. value is applied only to Y-axis of the trend graph, and not applied if View Present Y-axis is
automatically adjusted.
b. The min. value input can not be greater than the max. value.
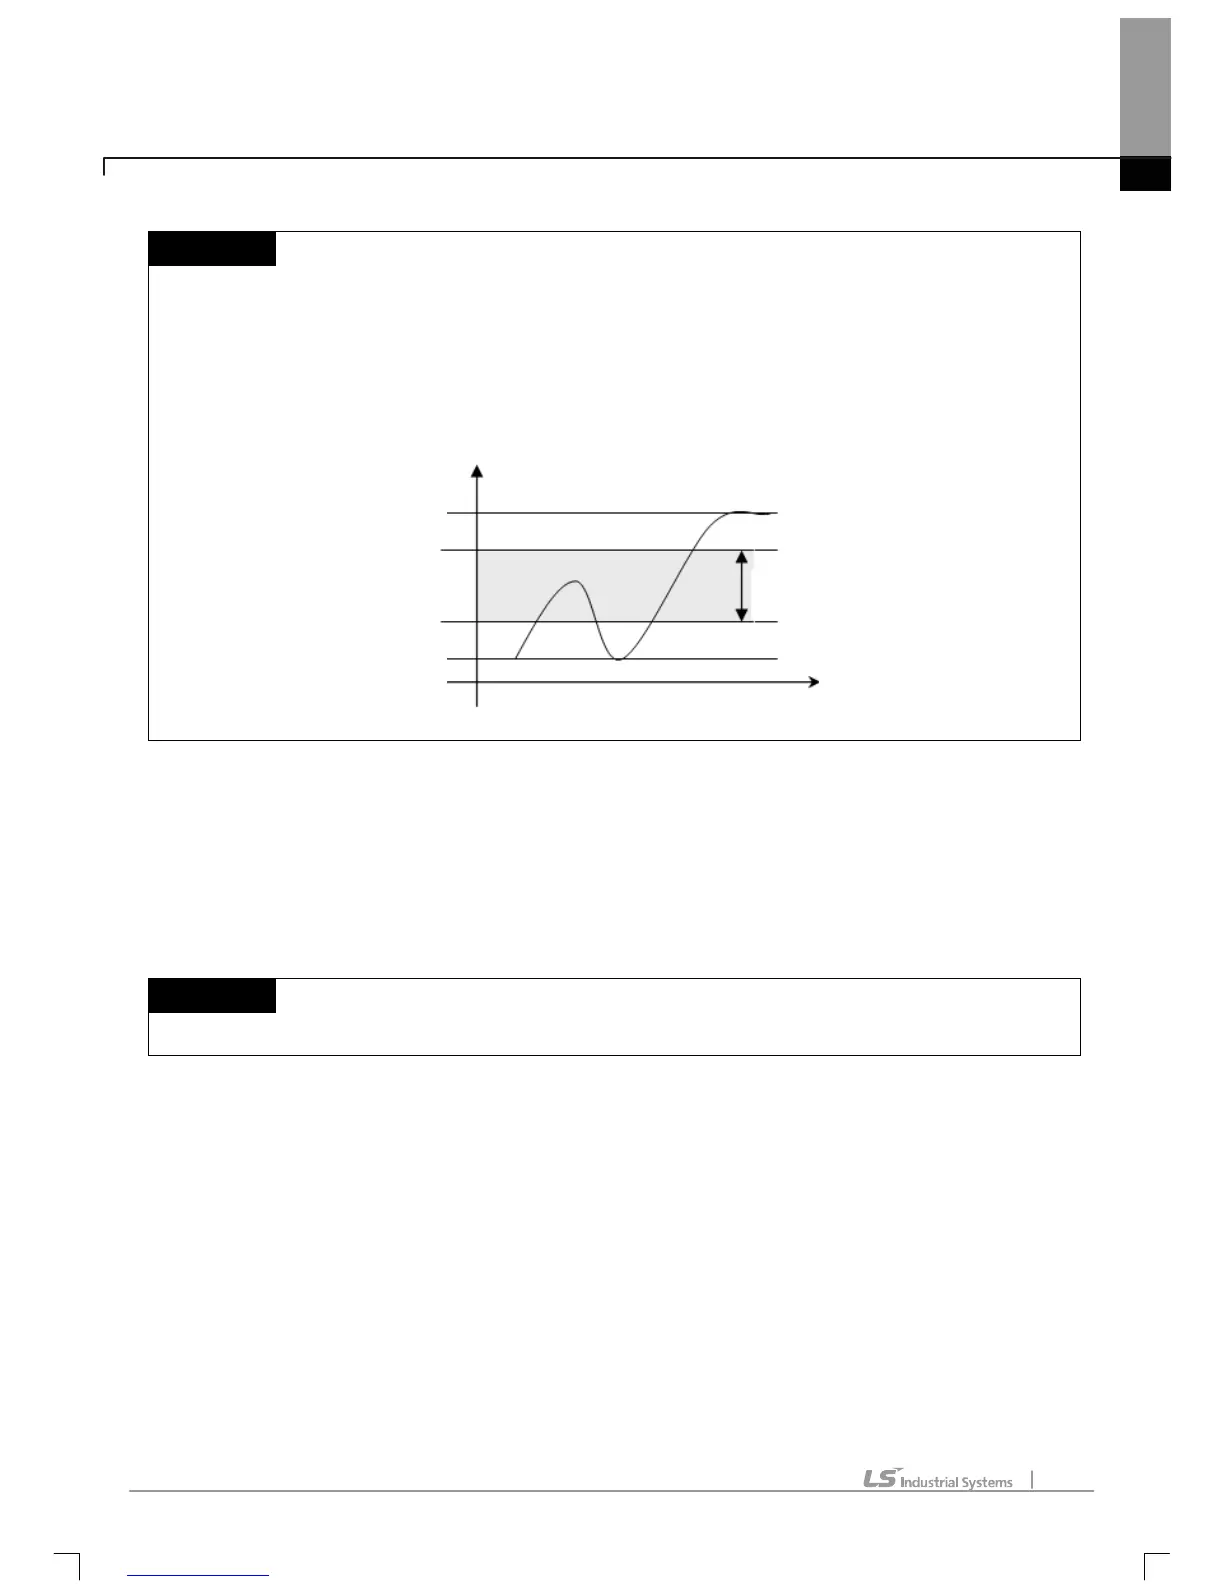
c. The actual data’s max./min. value range and specified graph’s max./min. value range are as shown below.
Only the range in gray will be displayed in the graph.
e. Bit graph legend: used to specify the position of bit graph index. No Index, Left Upper, Right Upper, Left
Bottom and Right Bottom are available for the Bit Index Position.
f. Trend graph legend: used to specify the position of trend graph index. No Index, Left Upper, Right Upper,
Left Bottom and Right Bottom are available for the Trend Index Position.
g. Color: used to specify device color of each graph.
Notes
a. If View Check Box is cancelled in Setting Color, its applicable device will not be displayed in the graph.
h. OK: applies the changed items and closes the dialog box.
i. Cancel: closes the dialog box.
Graph display range
Time
Value
Data max. value
Max. value (setting)
Min. value (setting)
Data min. value
 Loading...