EasyManuals Logo

LS Industrial Systems XG5000 User Manual

LS Industrial Systems XG5000
736 pages
To Next Page IconTo Next Page
To Previous Page IconTo Previous Page
Page #552 background imageLoading...
Page #552 background image
Chapter 11 Monitoring
11-80
11.7.3 Setting graph
[Steps]
1. Select [Graph]-[Graph Settings] on the menu.
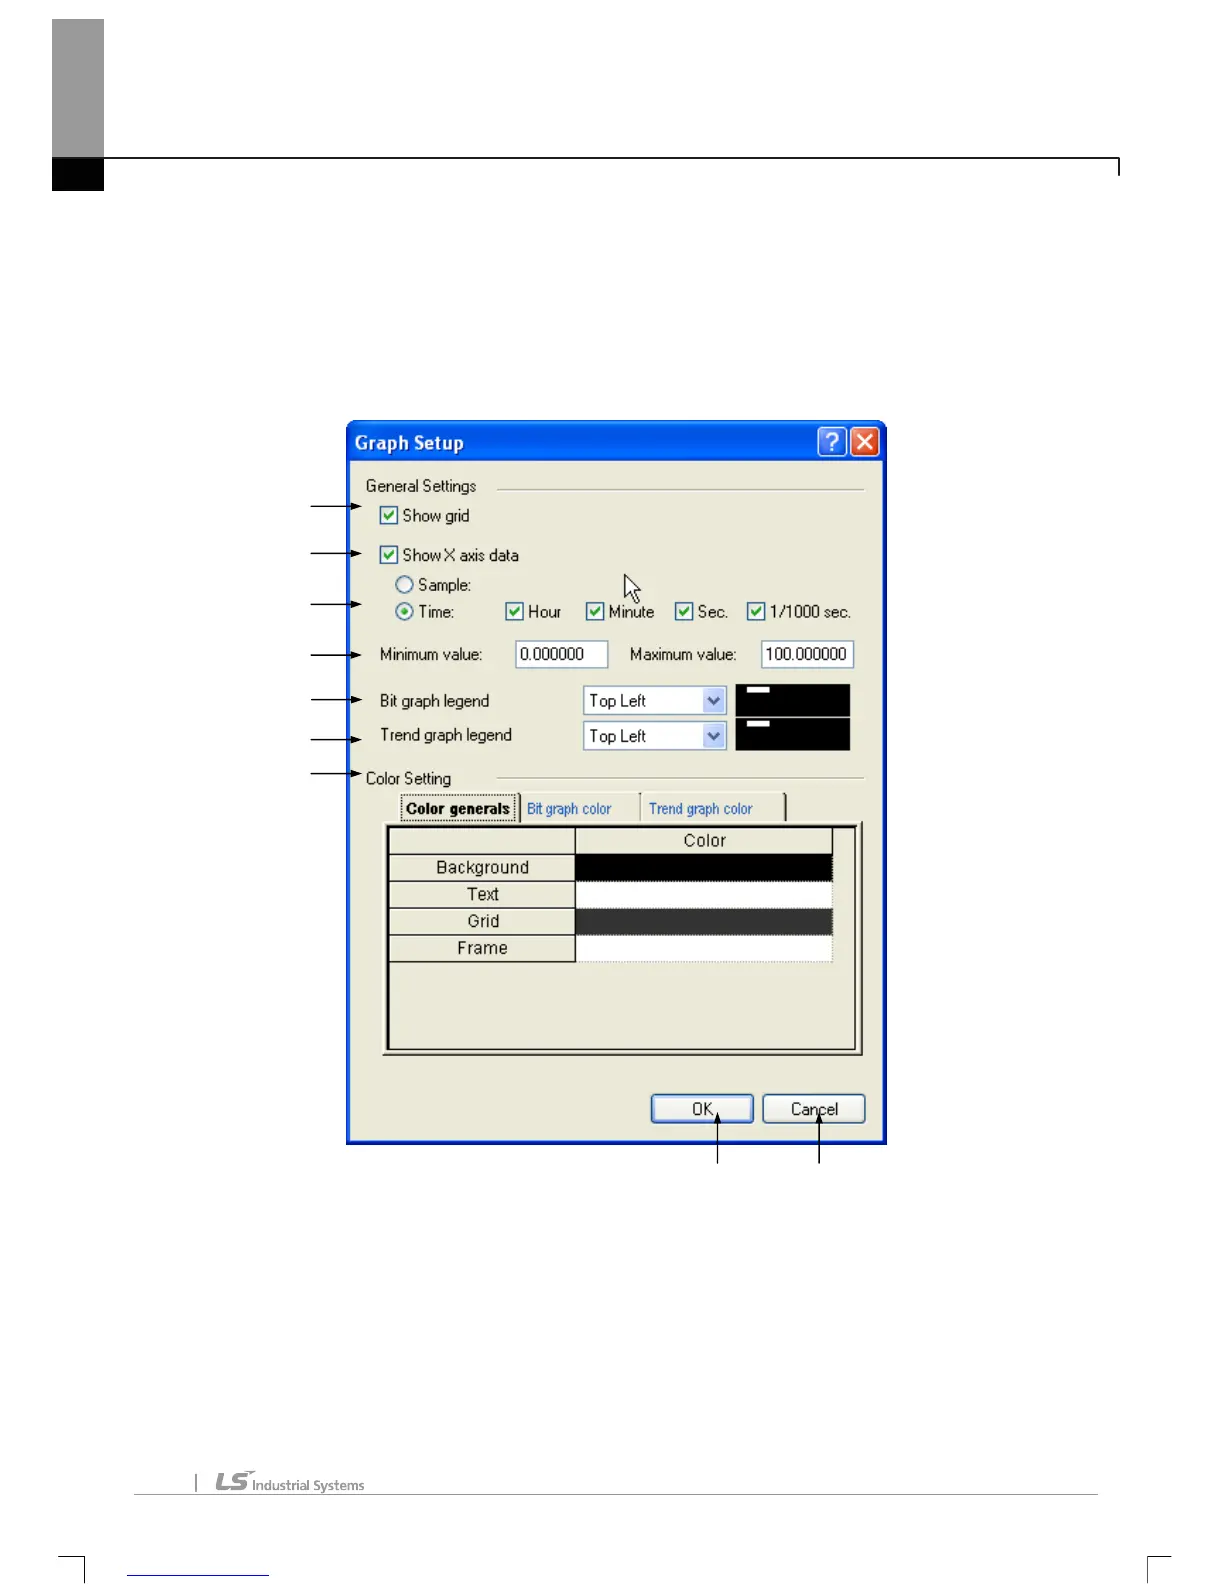
[Dialog Box]
[Description of Dialog Box]
a. Show grid: used to decide to show XY grid or not on the screen.
b. Show X-axis data: used to decide to show X-axis data or not.
c. X-axis data option: used to specify the display method of X-axis data.
d. Minimum value/Maximum value: used to set the max./min. range of the graph.
a
b
e
f
g
h
i
d
c

Table of Contents

Questions and Answers:

Question and Answer IconNeed help?

Do you have a question about the LS Industrial Systems XG5000 and is the answer not in the manual?

LS Industrial Systems XG5000 Specifications

General IconGeneral
BrandLS Industrial Systems
ModelXG5000
CategoryController
LanguageEnglish

Related product manuals