Measurements and Results
R&S
®
FSW
150User Manual 1173.9411.02 ─ 43
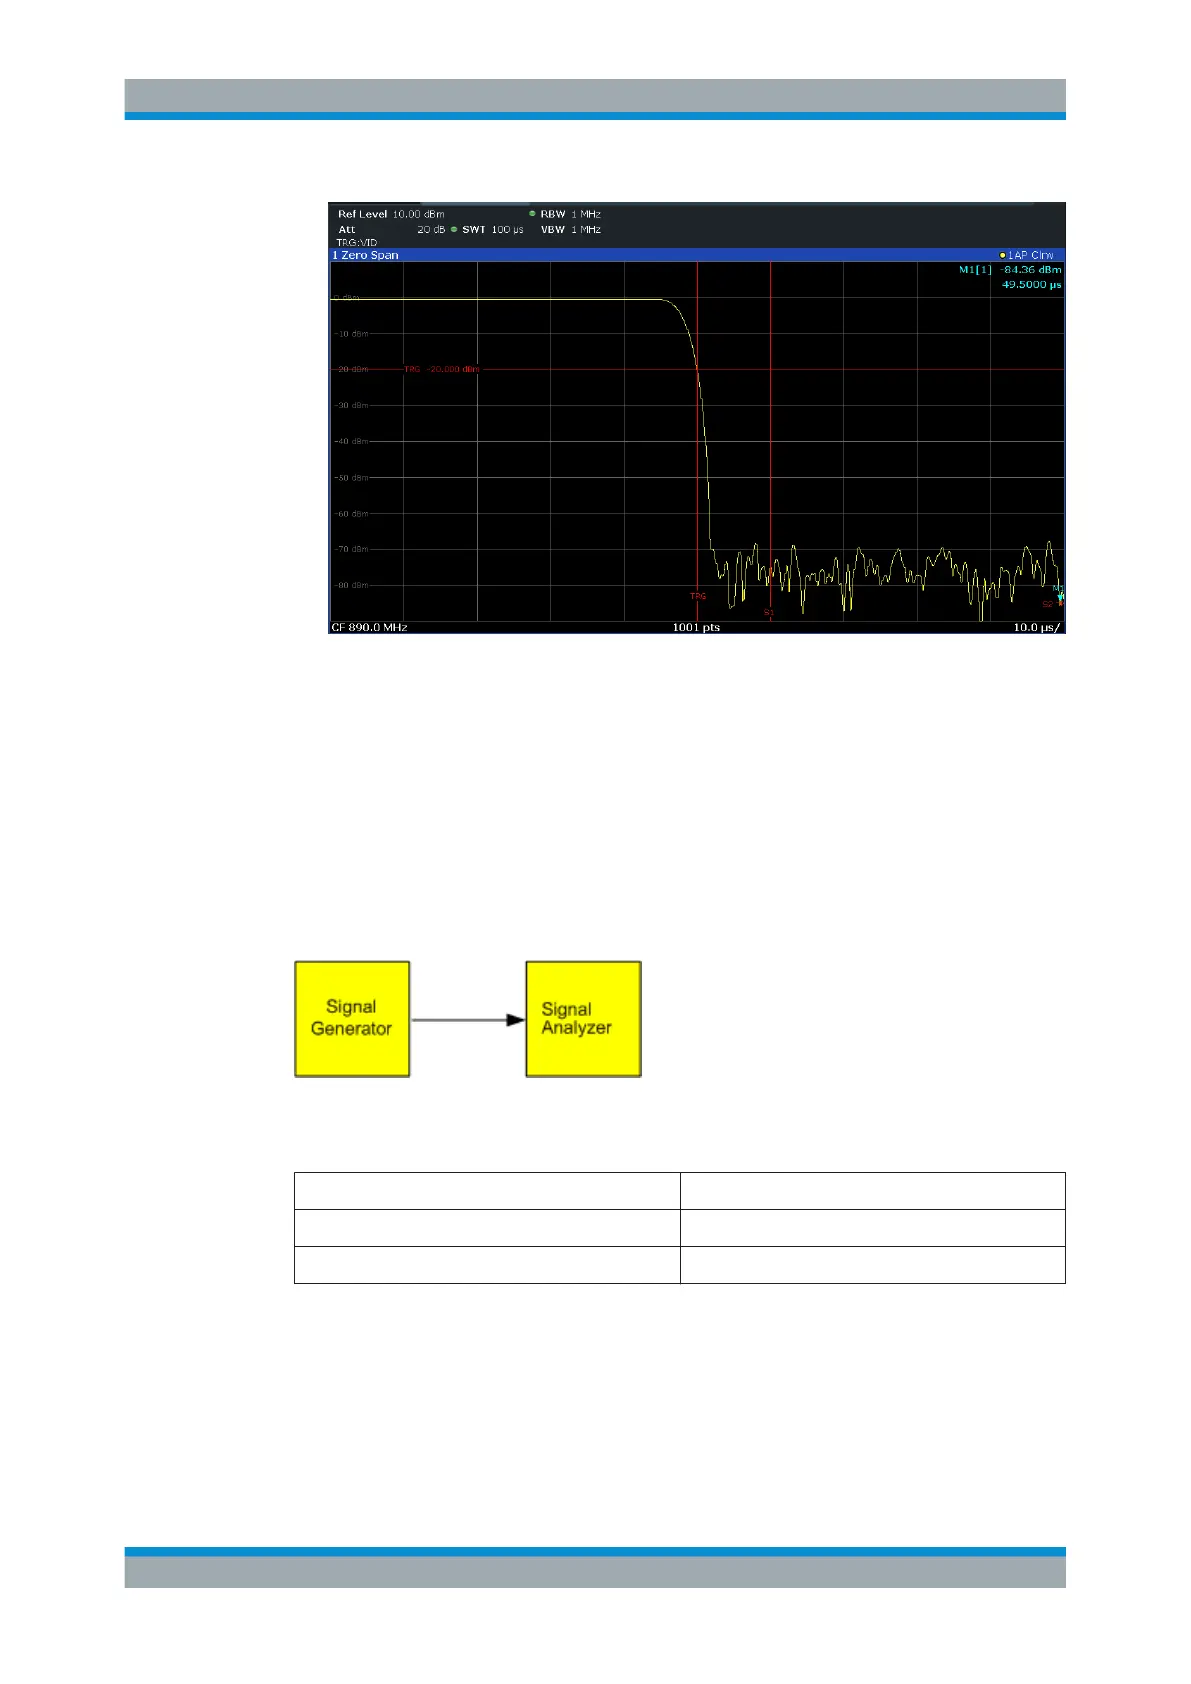
Figure 7-17: Falling edge of the GSM burst displayed with high time resolution
7.1.6.2 Measuring the Signal-to-Noise Ratio of Burst Signals
When TDMA transmission methods are used, the signal-to-noise ratio or the dynamic
range for deactivation can be measured by comparing the power values during the
activation phase and the deactivation phase of the transmission burst. Therefore, the
R&S FSW provides a measurement for absolute and relative power in zero span. In
the following example, the measurement is performed using a GSM burst.
Signal-to-Noise Ratio of a GSM Signal
Figure 7-18: Test setup
Table 7-8: Signal generator settings (e.g. R&S SMW)
Frequency 890 MHz
Level 0 dBm
Modulation GSM, one time slot is switched on
1. Select [PRESET] to reset the instrument.
2. Set the center frequency to 890
MHz.
3. Set the frequency span to 0
Hz.
4. Set the resolution bandwidth to 1
MHz.
Basic Measurements

 Loading...


