Common Analysis and Display Functions
R&S
®
FSW
575User Manual 1173.9411.02 ─ 43
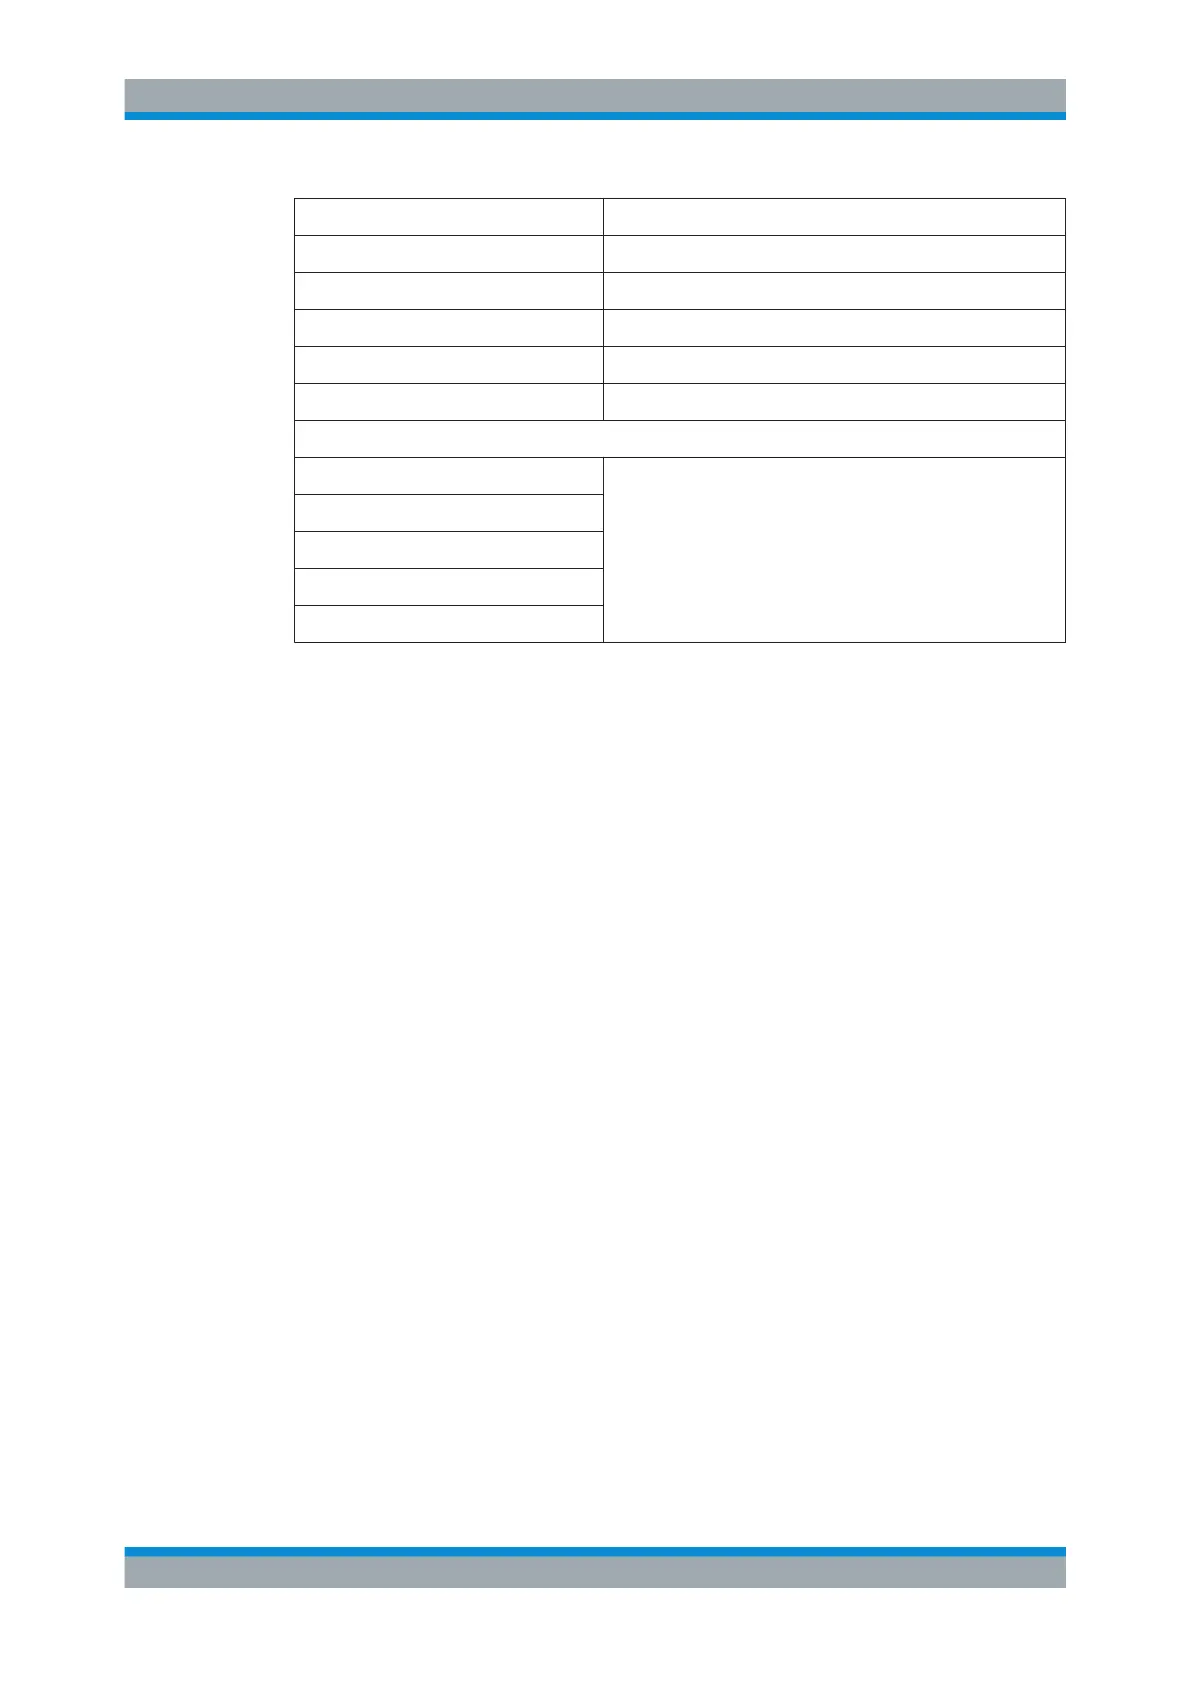
File contents Description
XAxisUnit;FREQ_HZ Unit of x values
XAxisScaleMode;ABSOLUTE Scaling of x-axis (absolute or relative)
YAxisUnit;LEVEL_DB Unit of y values
YAxisScaleMode;ABSOLUTE Scaling of y-axis (absolute or relative)
NoOfPoints;5 Number of points the line is defined by
Data section for individual data points
-4500000000;-50 x- and y-values of each data point defining the line
-2000000000;-30
-1000000000;0
0;-30
2500000000;-50
9.5 Trace Configuration
A trace is a collection of measured data points. The trace settings determine how the
measured data is analyzed and displayed on the screen.
● Standard Traces....................................................................................................575
● Spectrograms........................................................................................................588
● Trace Math............................................................................................................ 606
9.5.1 Standard Traces
9.5.1.1 Basics on Setting up Traces
Some background knowledge on traces is provided here for a better understanding of
the required configuration settings.
● Mapping Samples to sweep Points with the Trace Detector.................................575
● Analyzing Several Traces - Trace Mode............................................................... 579
● How Many Traces are Averaged - Sweep Count + Sweep Mode.........................580
● How Trace Data is Averaged - the Averaging Mode............................................. 581
● Trace Smoothing...................................................................................................581
Mapping Samples to sweep Points with the Trace Detector
A trace displays the values measured at the sweep points. The number of samples
taken during a sweep can be much larger than the number of sweep points that are
displayed in the measurement trace.
Trace Configuration

 Loading...


