Measurements and Results
R&S
®
FSW
140User Manual 1173.9411.02 ─ 43
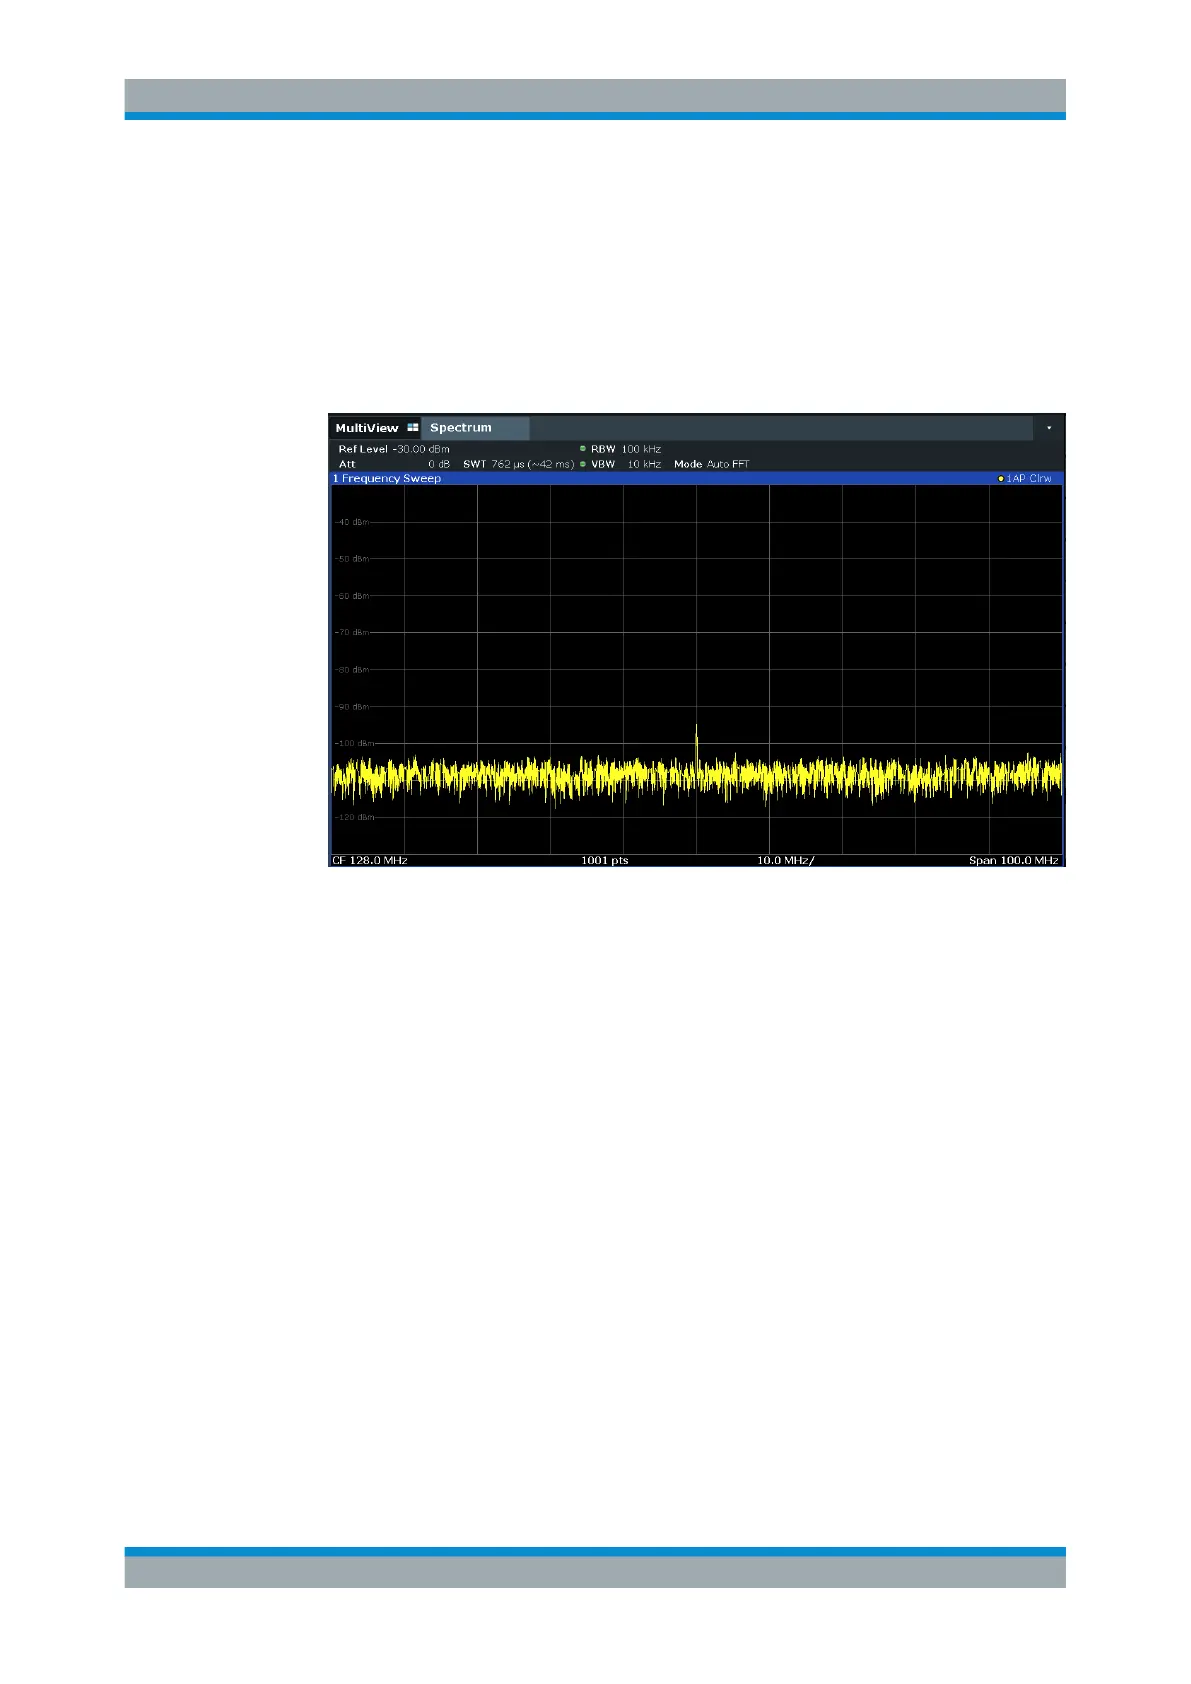
7. By reducing the resolution bandwidth by a factor of 10, the noise is reduced by
10 dB. Set the RBW to 100
kHz.
The displayed noise is reduced by approximately 10 dB. The signal, therefore,
emerges from noise by about 10 dB. Compared to the previous setting, the video
bandwidth has remained the same, i.e. it has increased relative to the smaller reso-
lution bandwidth. The averaging effect of the video bandwidth is therefore reduced.
The trace will be noisier.
Figure 7-4: Reference signal at a smaller resolution bandwidth
7.1.5 Measurement Examples - Measuring Signal Spectra with Multiple
Signals
● Separating Signals by Selecting the Resolution Bandwidth................................. 140
● Measuring the Modulation Depth of an AM-Modulated Carrier in the Frequency
Domain..................................................................................................................144
● Measuring AM-Modulated Signals........................................................................ 145
7.1.5.1 Separating Signals by Selecting the Resolution Bandwidth
A basic feature of a Signal and Spectrum Analyzer is the ability to separate the spec-
tral components of a mixture of signals. The resolution at which the individual compo-
nents can be separated is determined by the resolution bandwidth. Selecting a resolu-
tion bandwidth that is too large may make it impossible to distinguish between spectral
components, i.e. they are displayed as a single component (see also Chapter 8.5.1.1,
"Separating Signals by Selecting an Appropriate Resolution Bandwidth",
on page 460).
Two signals with the same amplitude can be resolved if the resolution bandwidth is
smaller than or equal to the frequency spacing of the signal. If the resolution bandwidth
Basic Measurements

 Loading...


