Measurements and Results
R&S
®
FSW
139User Manual 1173.9411.02 ─ 43
The traces of consecutive sweeps are averaged. To perform averaging, the
R&S FSW automatically switches on the sample detector. The RF signal, therefore,
can be more clearly distinguished from noise.
Figure 7-2: RF sine wave signal with low S/N ratio with an averaged trace
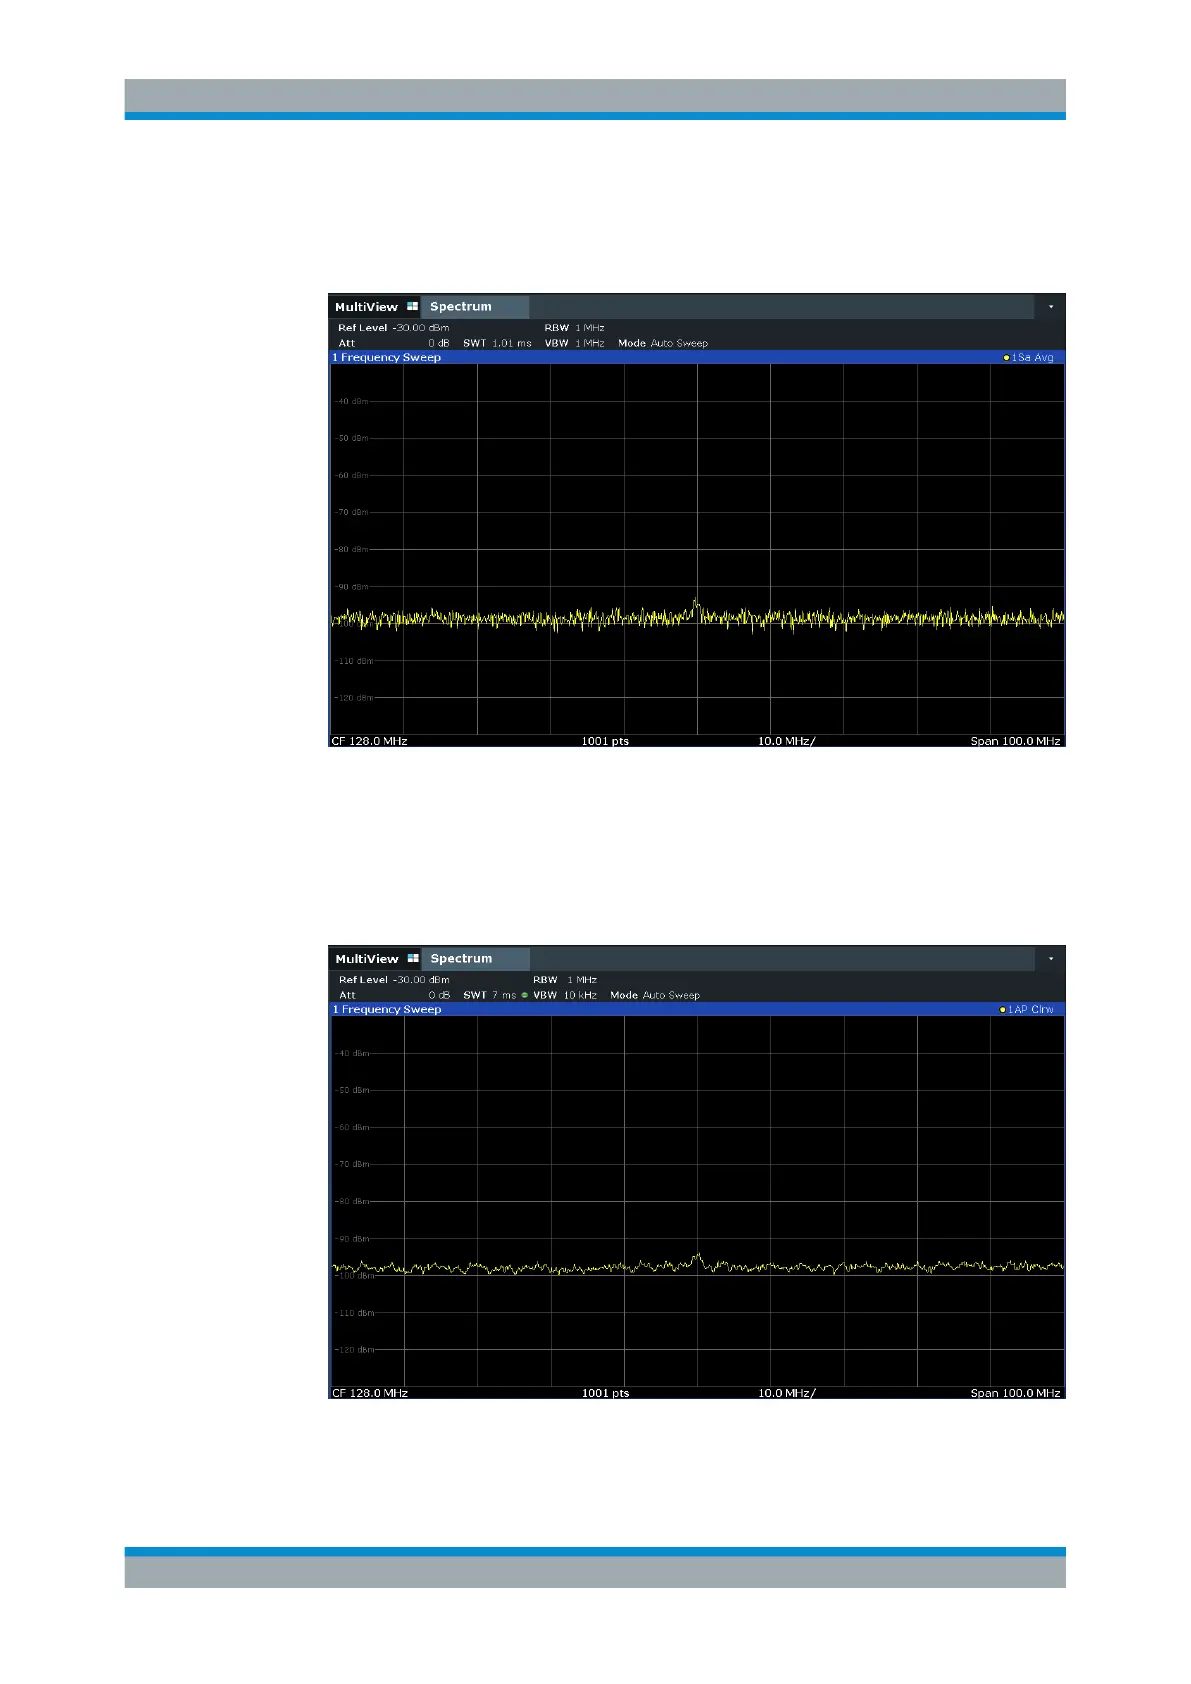
6. Instead of trace averaging, you can select a video filter that is narrower than the
resolution bandwidth. Set the trace mode back to "Clear/ Write", then set the VBW
to 10
kHz manually in the "Bandwidth" configuration dialog.
The RF signal can be distinguished from noise more clearly.
Figure 7-3: RF sine wave signal with low S/N ratio with a smaller video bandwidth
Basic Measurements

 Loading...


