Measurements and Results
R&S
®
FSW
308User Manual 1173.9411.02 ─ 43
Mode Description
Peak Peak value from the points of the displayed trace or a segment
thereof.
RMS RMS value from the points of the displayed trace or a segment
thereof.
Mean Mean value from the points of the displayed trace or a segment
thereof. The linear mean value of the equivalent voltages is calcula-
ted.
For example to measure the mean power during a GSM burst
Std Dev The standard deviation of the measurement points from the mean
value.
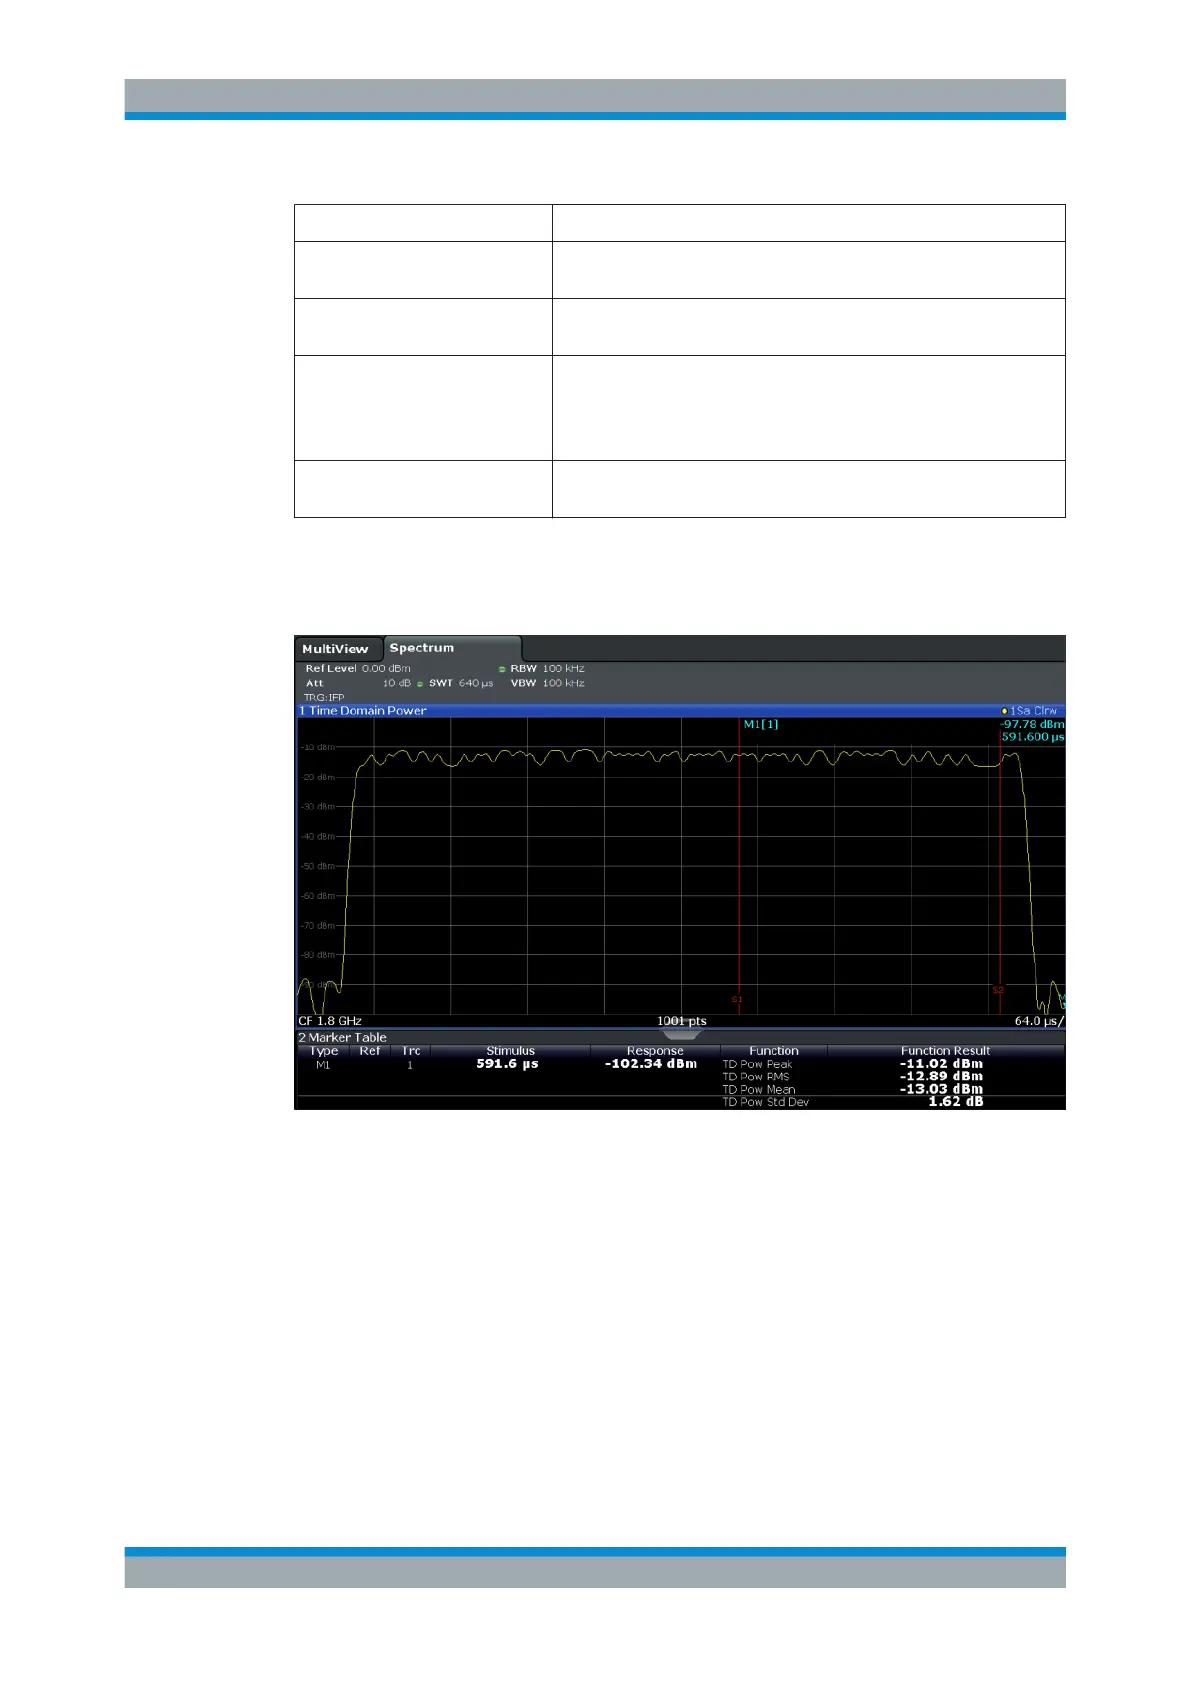
The result is displayed in the marker results, indicated by "Power" and the selected
power mode, e.g. "RMS". The measured values are updated after each sweep or aver-
aged over a user-defined number of sweeps (trace averaging).
The results can also be queried using the remote commands described in
Chap-
ter 14.5.10, "Measuring the Time Domain Power", on page 977.
7.9.3 Time Domain Power Basics - Range Definition Using Limit Lines
The range of the measured signal to be evaluated for the power measurement can be
restricted using limit lines. The left and right limit lines (S1, S2) define the evaluation
range and are indicated by vertical red lines in the diagram. If activated, the power
results are only calculated from the levels within the limit lines.
For example, if both the on and off phase of a burst signal are displayed, the measure-
ment range can be limited to the transmission or to the muting phase. The ratio
Time Domain Power Measurement

 Loading...


