Common Analysis and Display Functions
R&S
®
FSW
588User Manual 1173.9411.02 ─ 43
3. Select the "Copy to Trace" button for the trace to which the settings are to be
applied.
The settings from the source trace are applied to the destination trace. The newly
configured trace (if not set to "Blank") is displayed after the next sweep.
9.5.2 Spectrograms
9.5.2.1 Working with Spectrograms
In addition to the standard "level versus frequency" or "level versus time" traces, the
R&S FSW also provides a spectrogram display of the measured data.
A spectrogram shows how the spectral density of a signal varies over time. The x-axis
shows the frequency, the y-axis shows the time. A third dimension, the power level, is
indicated by different colors. Thus you can see how the strength of the signal varies
over time for different frequencies.
Three-dimensional spectrograms are also available and are described in "Three-
Dimensional Spectrograms" on page 592. Most basic information described in the
following sections applies similarly to both two- and three-dimensional spectrograms.
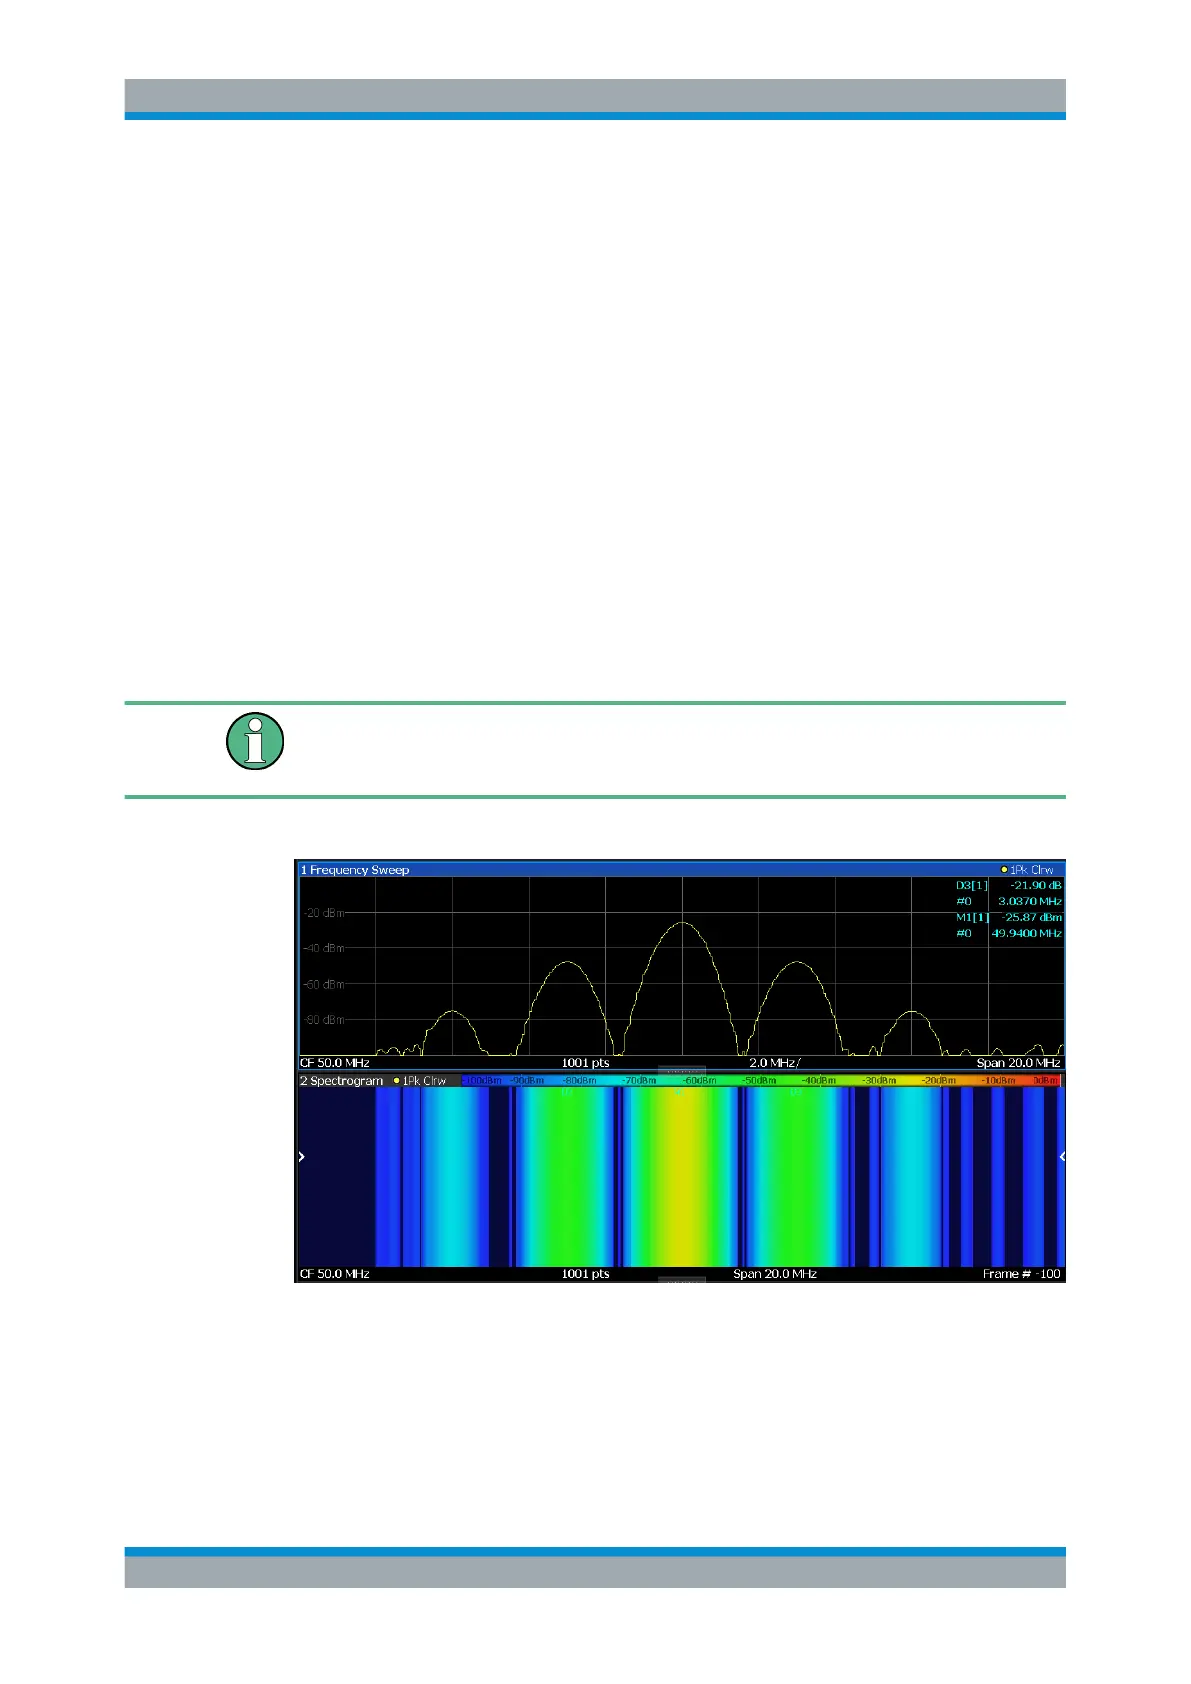
Example:
In this example, you see the spectrogram for the calibration signal of the R&S FSW,
compared to the standard spectrum display. Since the signal does not change over
time, the color of the frequency levels does not change over time, i.e. vertically. The
legend above the spectrogram display describes the power levels the colors represent.
Trace Configuration

 Loading...


