Common Analysis and Display Functions
R&S
®
FSW
589User Manual 1173.9411.02 ─ 43
Result display
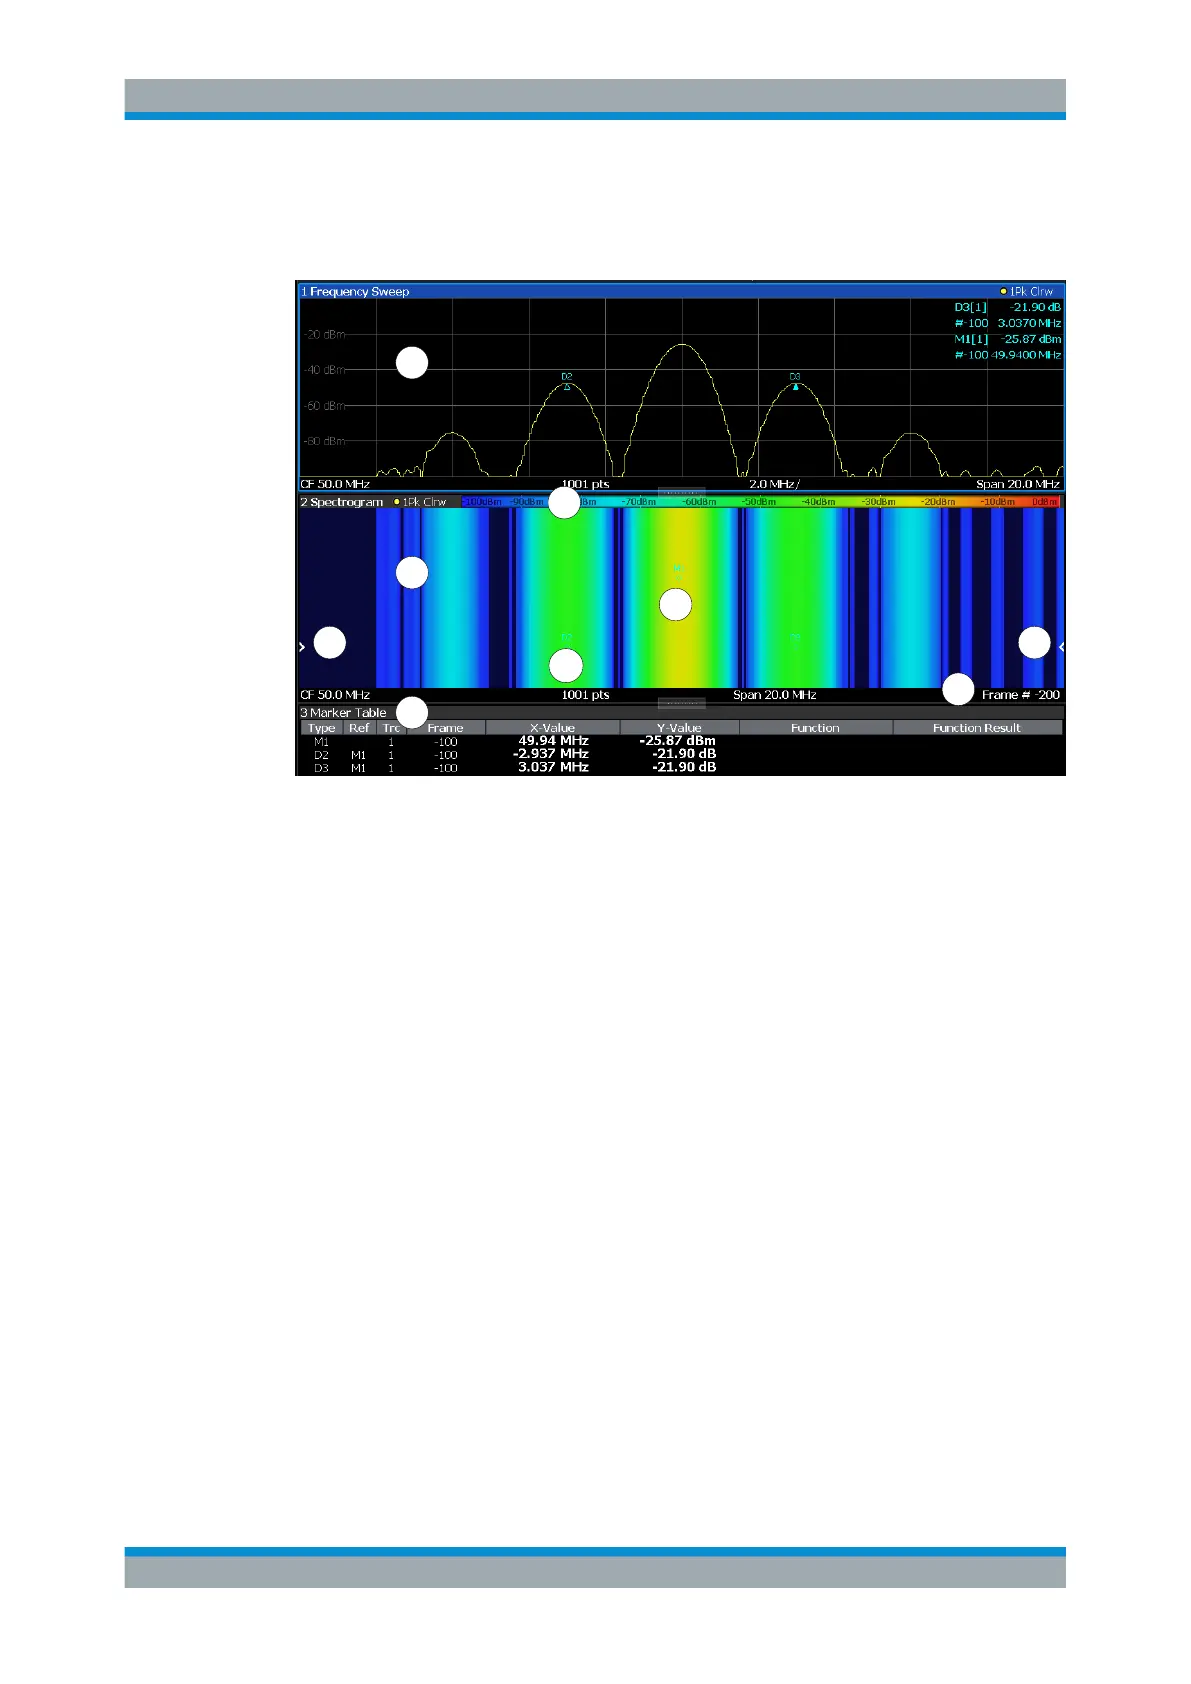
The spectrogram result can consist of the following elements:
2
1
3
4
6
8
7
5
8
Figure 9-14: Screen layout of the spectrogram result display
1 = Spectrum result display
2 = Spectrogram result display
3 = Marker list
4 = Marker
5 = Delta marker
6 = Color map
7 = Timestamp / frame number
8 = Current frame indicator
For more information about spectrogram configuration, see Chapter 9.5.2.2, "Spectro-
gram Settings", on page 597.
Remote commands:
Activating and configuring spectrograms:
Chapter 14.8.2.2, "Configuring Spectrograms", on page 1132
Storing results:
MMEMory:STORe<n>:SPECtrogram on page 1254
● Time Frames......................................................................................................... 590
● Markers in the Spectrogram..................................................................................591
● Three-Dimensional Spectrograms........................................................................ 592
● Color Maps............................................................................................................594
Trace Configuration

 Loading...


