Measurements and Results
R&S
®
FSW
281User Manual 1173.9411.02 ─ 43
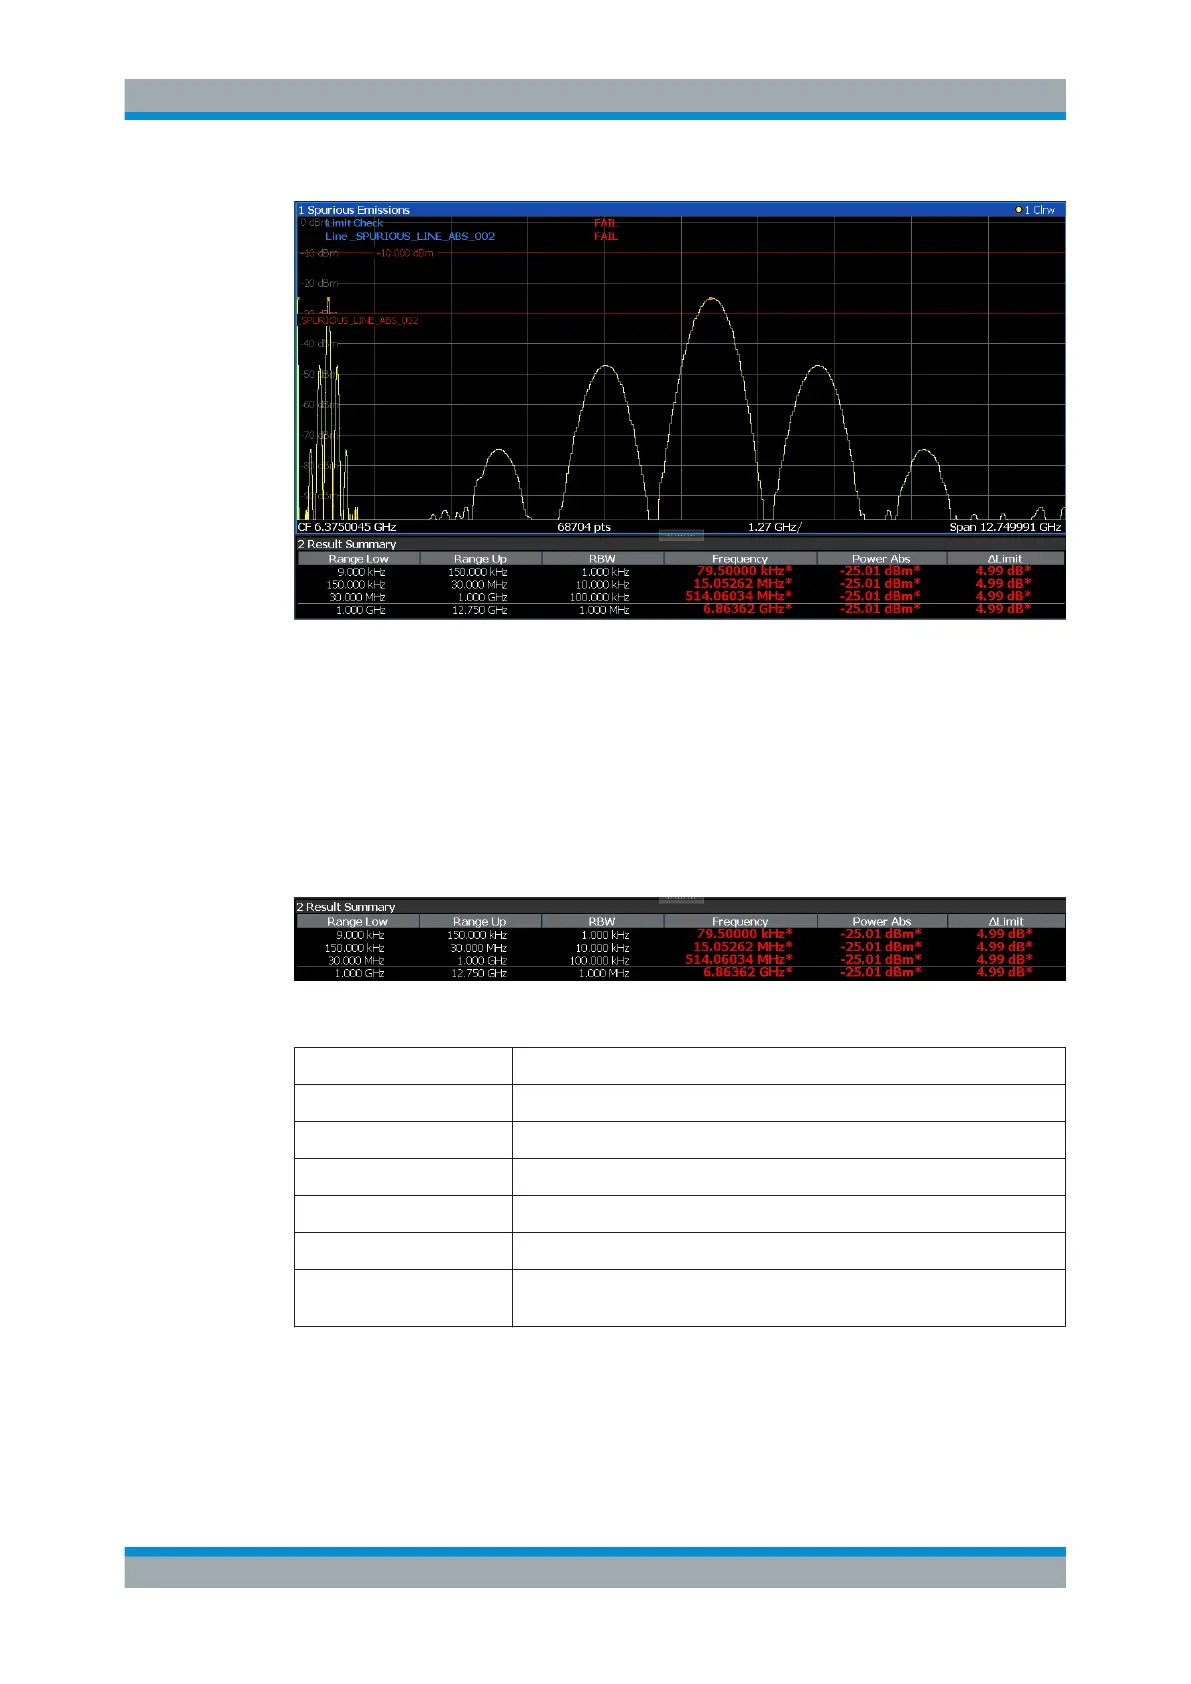
7.7.2 Spurious Emissions Measurement Results
The measured signal, including any spurious emissions, and optionally the detected
peaks are displayed in the Spurious Emissions measurement diagram. If defined, the
limit lines and the limit check results are also indicated. In addition to the graphical
results, a result table can be displayed to evaluate the measured powers and limit
check results (see also Chapter 7.7.3.2, "Limit Lines in Spurious Measurements",
on page 283). The details of the evaluation list can be configured.
The following information is provided in the evaluation list for each range:
Column Description
Range Low Frequency range start for the range the peak value belongs to
Range Up Frequency range end for the range the peak value belongs to
RBW RBW of the range
Frequency Frequency at the peak value
Power Abs Absolute power level at the peak value
ΔLimit Deviation of the absolute power level from the defined limit for the peak
value
By default, one peak per range is displayed. However, you can change the settings to:
●
Display all peaks
●
Display a certain number of peaks per range
●
Display only peaks that exceed a threshold ("Margin")
Spurious Emissions Measurement

 Loading...


