Measurements and Results
R&S
®
FSW
138User Manual 1173.9411.02 ─ 43
The displayed noise level of a signal analyzer depends on its noise figure, the selected
RF attenuation, the selected reference level, the selected resolution and video band-
width and the detector.
For details see:
●
Chapter 8.4.1.2, "RF Attenuation", on page 450
●
Chapter 8.4.1.1, "Reference Level", on page 449
●
Chapter 8.5.1.1, "Separating Signals by Selecting an Appropriate Resolution Band-
width", on page 460
●
Chapter 8.5.1.2, "Smoothing the Trace Using the Video Bandwidth", on page 460
●
"Mapping Samples to sweep Points with the Trace Detector" on page 575
This measurement example shows the different factors influencing the S/N ratio.
Table 7-2: Signal generator settings (e.g. R&S SMW)
Frequency 128 MHz
Level -95 dBm
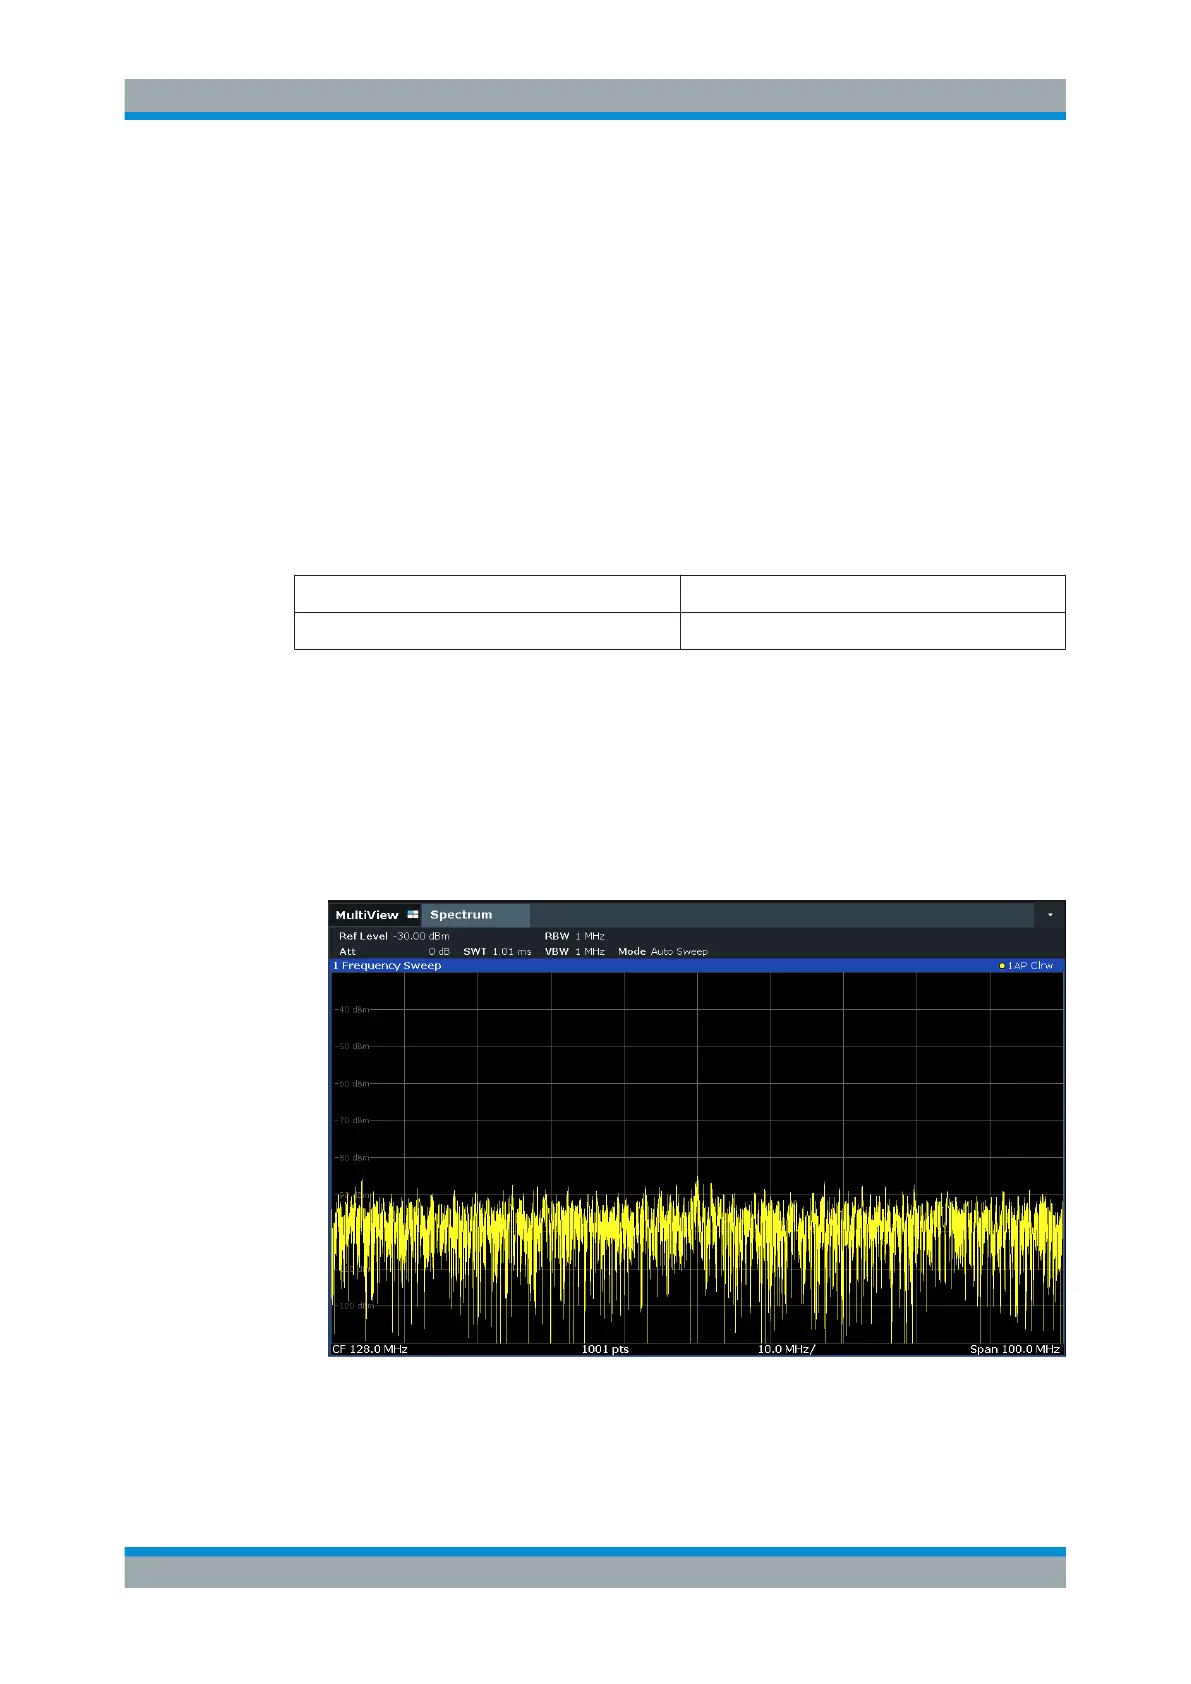
1. Preset the R&S FSW.
2. Set the center frequency to 128 MHz.
3. Set the span to 100 MHz.
4. Set the reference level to-30
dBm.
The signal is measured with the auto peak detector and is completely hidden in the
intrinsic noise of the R&S FSW.
Figure 7-1: Sine wave signal with low S/N ratio
5. To suppress noise spikes, average the trace. In the "Traces" configuration dialog,
set the "Trace Mode" to "Average" (see "Trace Mode" on page 583).
Basic Measurements

 Loading...


