Measurements and Results
R&S
®
FSW
141User Manual 1173.9411.02 ─ 43
is equal to the frequency spacing, the spectrum display shows a level drop of 3 dB pre-
cisely in the center of the two signals. Decreasing the resolution bandwidth makes the
level drop larger, which thus makes the individual signals clearer.
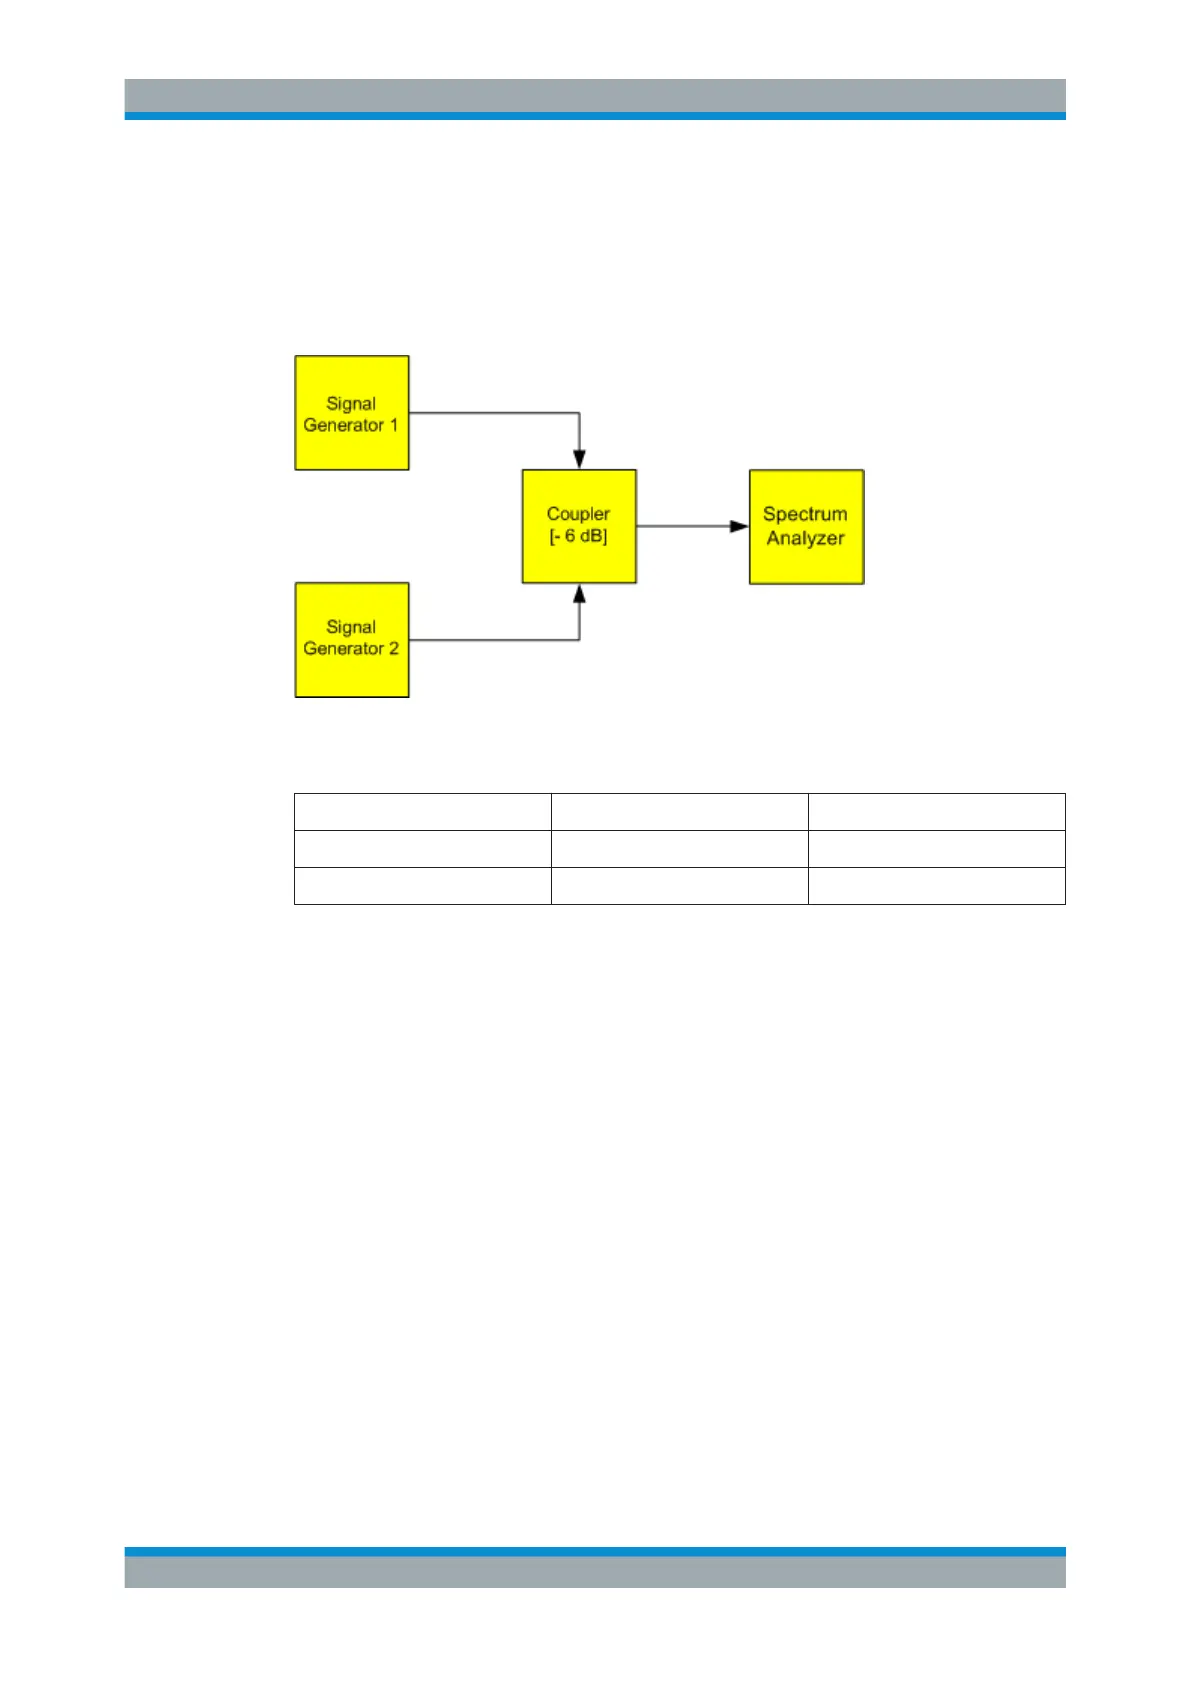
In this measurement example we will analyze two signals with a level of -30 dBm each
and a frequency spacing of 30 kHz.
Figure 7-5: Test setup
Table 7-3: Signal generator settings (e.g. R&S SMW)
Level Frequency
Signal generator 1 -30 dBm 128,00 MHz
Signal generator 2 -30 dBm 128,03 MHz
1. Select [PRESET] to reset the instrument.
2. Set the center frequency to 128.015
MHz.
3. Set the frequency span to 300
kHz.
4. Set the resolution bandwidth to 30
kHz and the video bandwidth to 1
kHz.
Note: Larger video bandwidths. The video bandwidth is set to 1 kHz in order to
make the level drop in the center of the two signals clearly visible. At larger video
bandwidths, the video voltage that results from envelope detection is not suffi-
ciently suppressed. This produces additional voltages, which are visible in the
trace, in the transition area between the two signals.
Basic Measurements

 Loading...


