Measurements and Results
R&S
®
FSW
295User Manual 1173.9411.02 ─ 43
In addition to the histogram, a result table is displayed containing the following informa-
tion:
●
Number of samples used for calculation
●
For each displayed trace:
– Mean amplitude
– Peak amplitude
– Crest factor
The crest factor is defined as the peak power to mean power ratio or, logarith-
mically, as the peak level minus the average level of the signal.
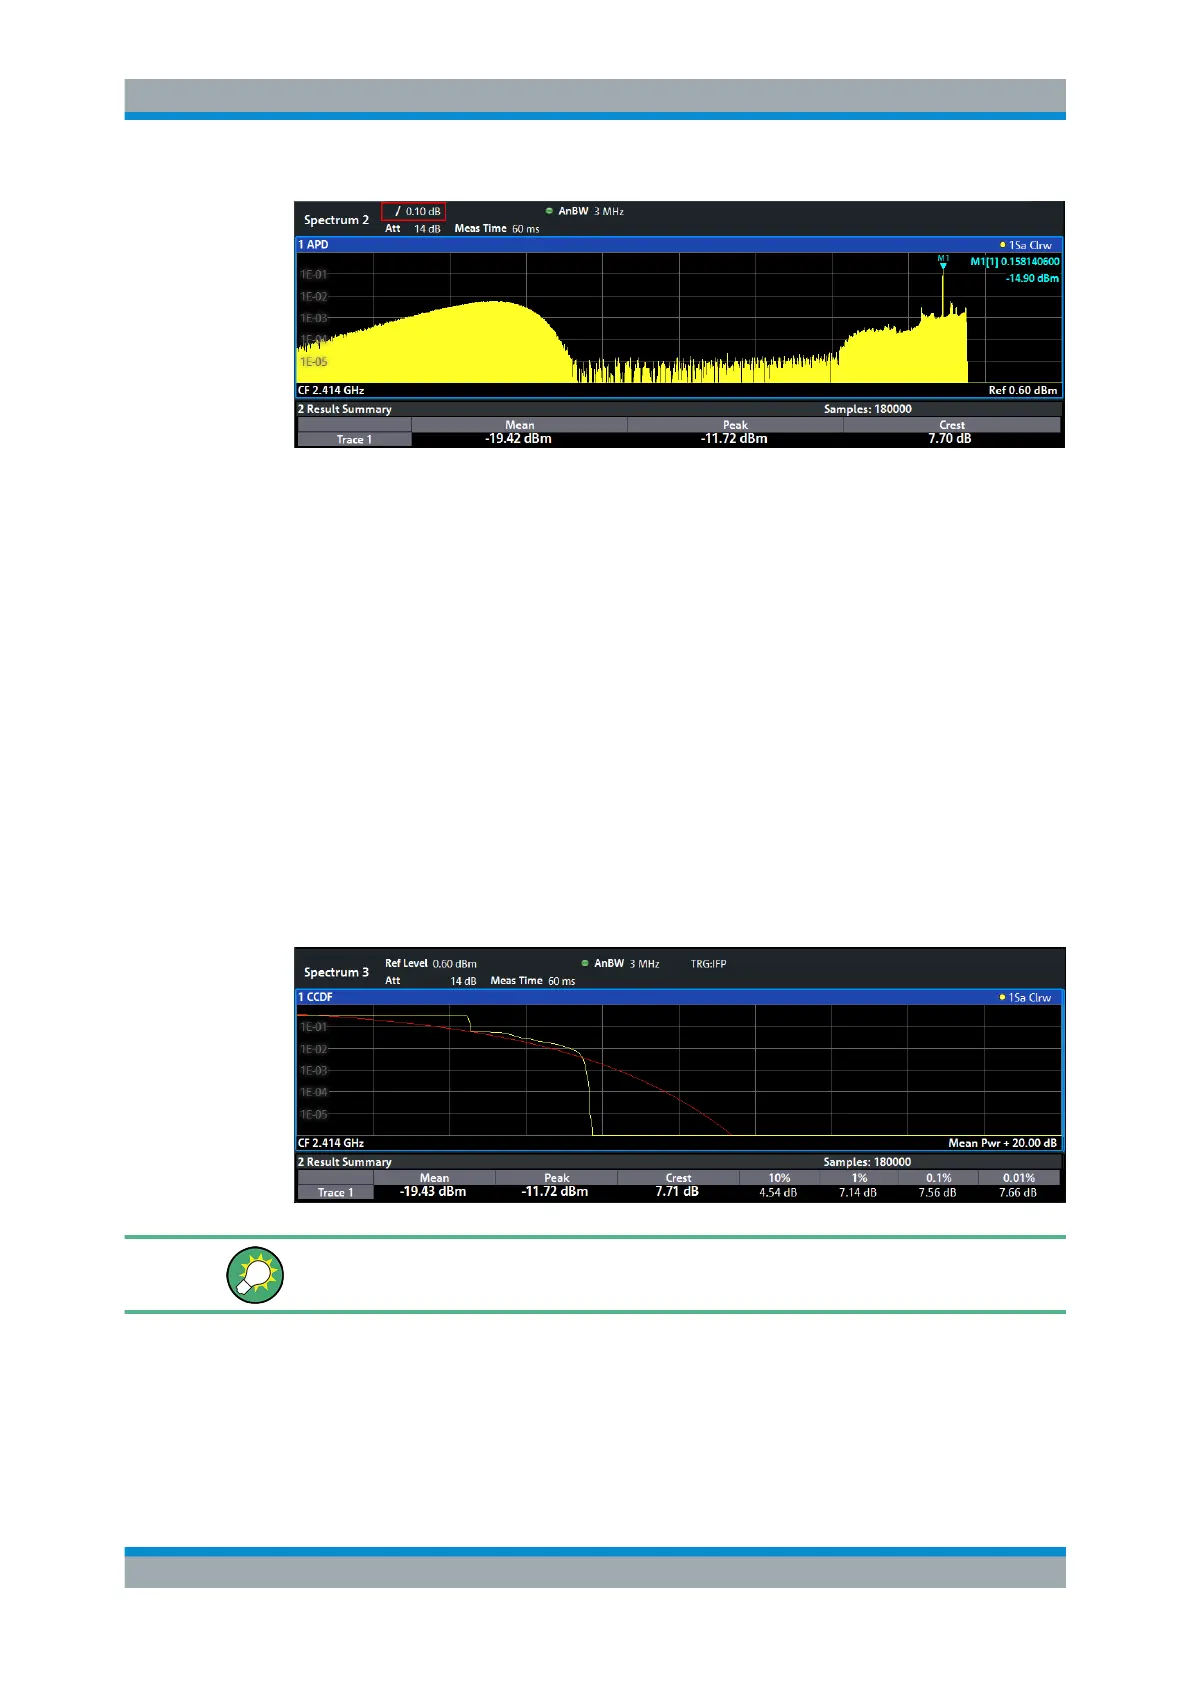
Complementary Cumulative Distribution Function (CCDF)
The Complementary Cumulative Distribution Function (CCDF) shows the probability
that the mean signal power amplitude will be exceeded in percent. The level above the
mean power is plotted along the x-axis of the graph. The origin of the axis corresponds
to the mean power level. The probability that a level will be exceeded is plotted along
the y-axis.
A red line indicates the ideal Gaussian distribution for the measured amplitude range.
The displayed amplitude range is indicated as "Mean Pwr" + "<x dB>"
In addition to the histogram, a result table is displayed containing the following informa-
tion:
●
Number of samples used for calculation
Statistical Measurements (APD, CCDF)

 Loading...


