Measurements and Results
R&S
®
FSW
301User Manual 1173.9411.02 ─ 43
Note: You can define the time values with a greater numerical resolution than is dis-
played; the values are only rounded for display.
Remote command:
[SENSe:]SWEep:EGATe:TRACe<t>:STARt<gr> on page 970
[SENSe:]SWEep:EGATe:TRACe<t>:STOP<gr> on page 970
7.8.5.3 Scaling for Statistics Diagrams
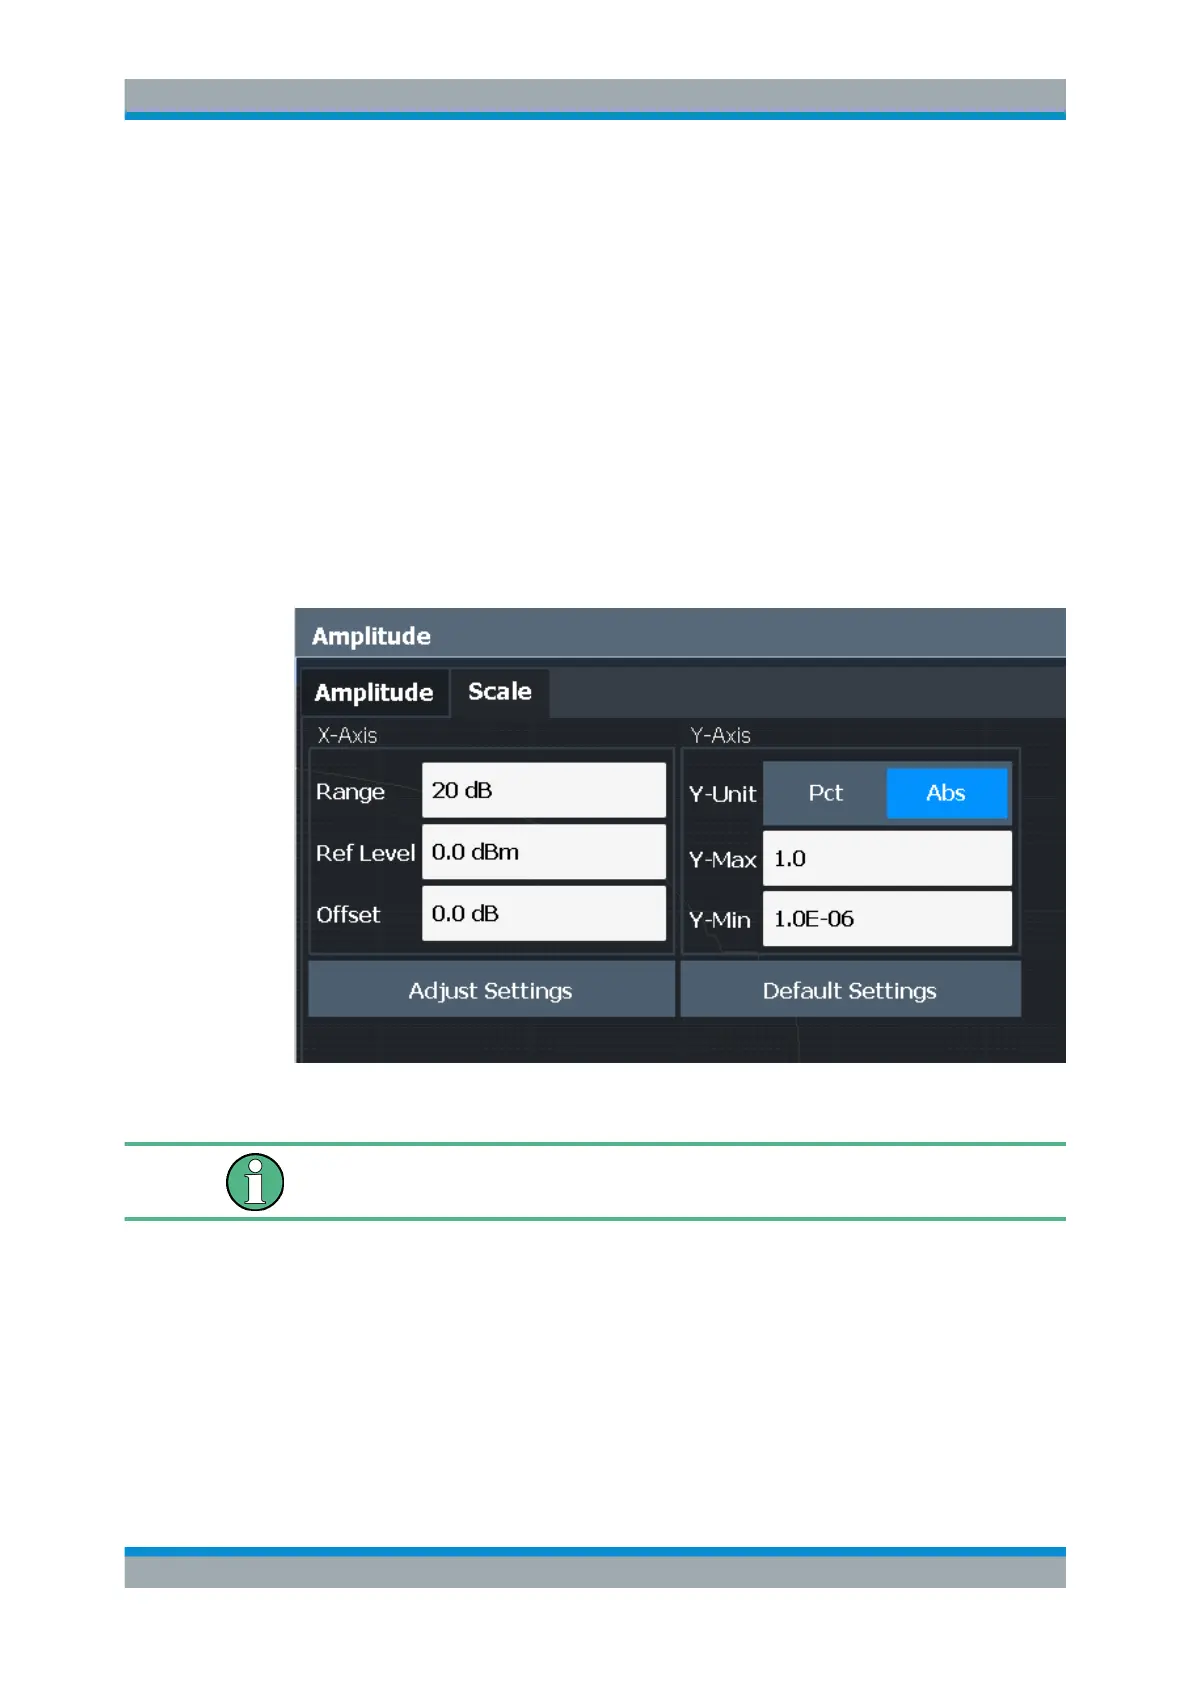
Access: "Overview" > "Amplitude" > "Scale" tab
Or: [AMPT] > "Scale Config"
For statistics displays, scale settings are available for both the y-axis and the x-axis.
The remote commands required to perform these tasks are described in Chap-
ter 14.5.9.4, "Scaling the Diagram", on page 971.
Figure 7-49: Scale settings for CCDF diagram
In statistical diagrams, the x-axis displays the signal level values (= y-axis in standard
display), while the y-axis displays the probability of the values.
X-Axis..........................................................................................................................302
└ Ref Level.......................................................................................................302
└ Range........................................................................................................... 302
└ Shifting the Display (Offset).......................................................................... 302
Y-Axis.......................................................................................................................... 302
└ Y-Unit............................................................................................................ 302
└ Y-Max/ Y-Min.................................................................................................302
Default Settings...........................................................................................................302
Adjust Settings............................................................................................................ 303
Statistical Measurements (APD, CCDF)

 Loading...


