Getting Started
R&S
®
FSW
69User Manual 1173.9411.02 ─ 43
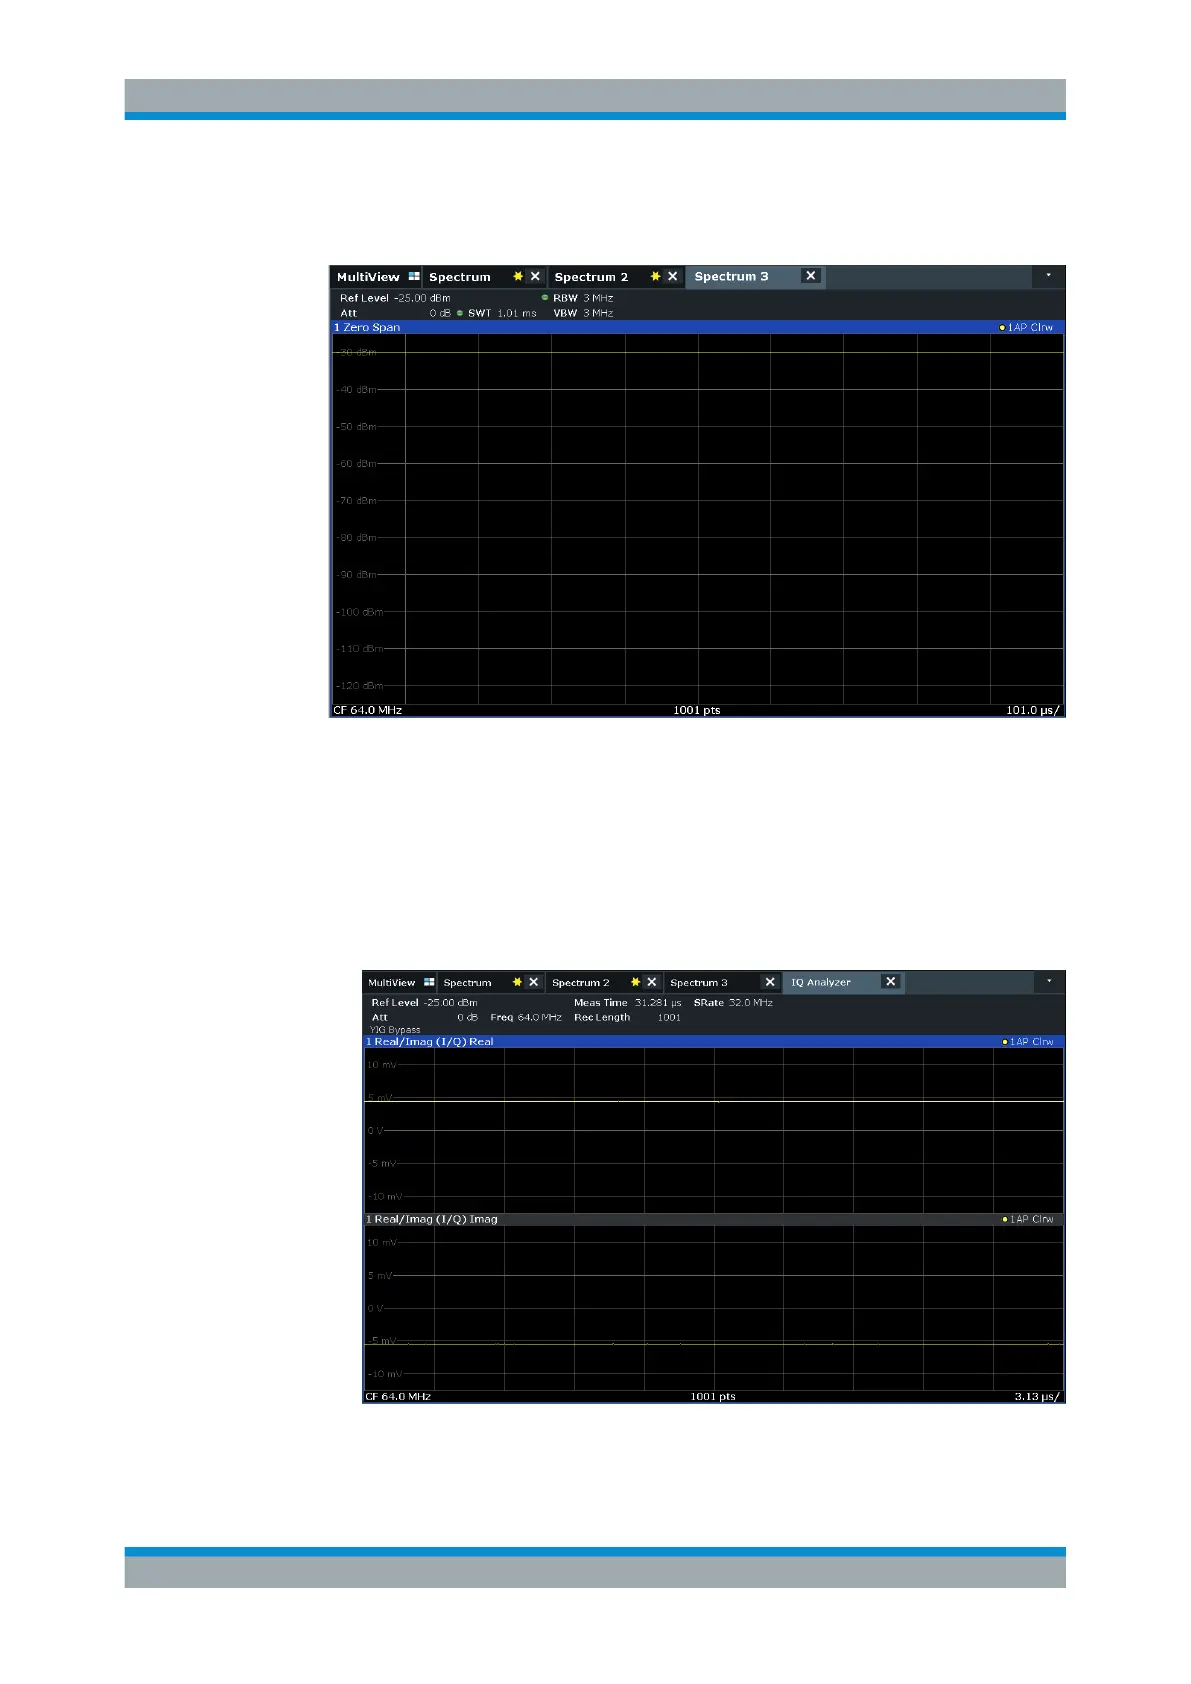
As the calibration signal does not vary over time, the level versus time diagram dis-
plays a straight line.
Figure 5-10: Time domain display of the calibration signal
5. Create a new channel for I/Q analysis:
a) Press the [Mode] key.
b) Tap the "IQ Analyzer" button to activate a channel for the I/Q Analyzer applica-
tion.
c) Tap the "Display Config" softkey to activate the SmartGrid mode.
d) Drag the "Real/Imag (I/Q)" icon from the evaluation bar to the SmartGrid.
Figure 5-11: Inserting a Real/Imag diagram for I/Q analysis
Trying Out the Instrument

 Loading...


