ECDIS-E User Guide Charts
65934012 4-59
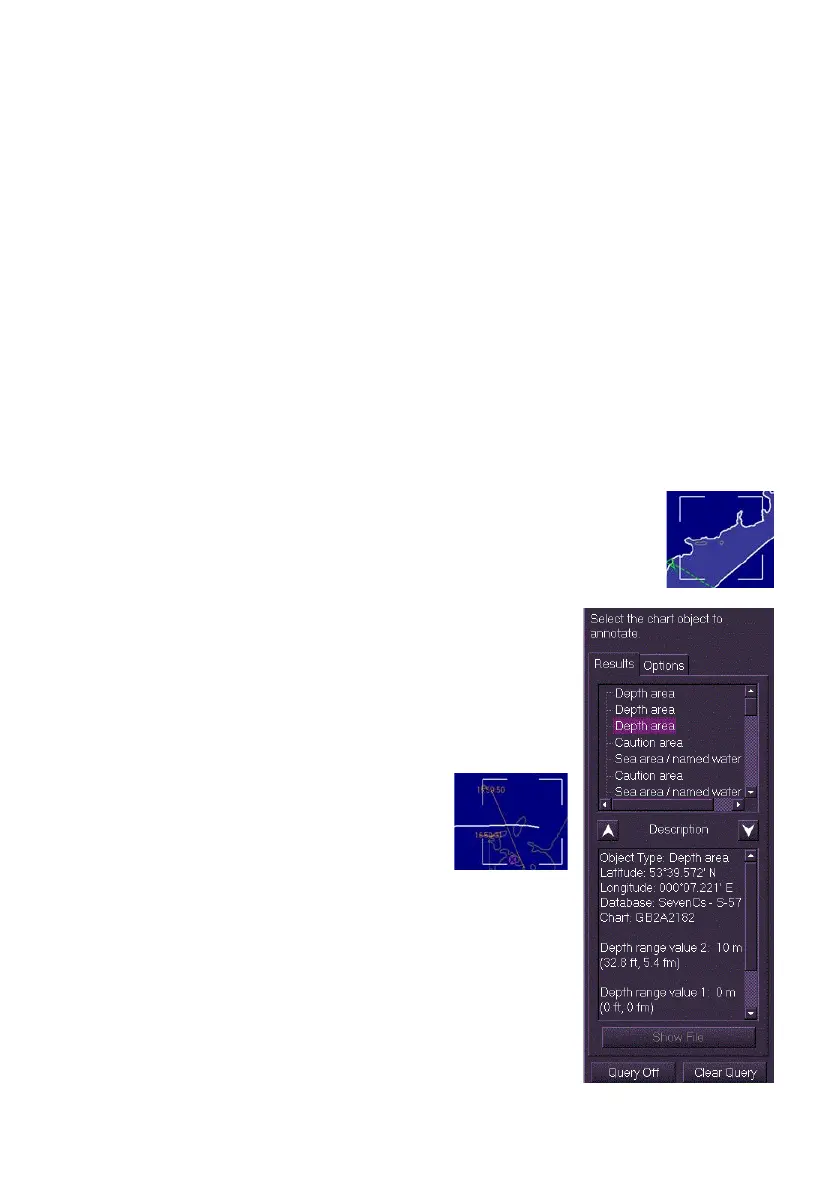
5. A date dependent object will be shown on screen as a white outline
box and a lighter shade inside. The Chart Query description will
give details of the date dependent Start and End dates.
All date dependent objects may also be located by selecting Highlight
Objects in the Chart Settings Symbology window and selecting the
particular day or date range for that object from the window.
When Highlight Objects has been enabled all date dependent objects are
displayed with an orange highlight marker.
Add Annotation Mark
The Add Annotation Mark feature allows you to highlight an ENC object
(either an area, line or point) on the chart display and add a note to the
selected chart object.
To annotate a chart object do the following:
1. Click on the Add Annotation Mark button, the following screen
prompts to select the chart object to annotate.
2. Move the cursor onto the chart display and click the
ENC chart object you want to annotate, a white
dashed outline box is drawn on the chart area. The
size of the box is dependent on the query area size
selected in the Chart Query Options tab .
3. The Results tab of the Add Annotation Mark
window lists all ENC chart objects in the
defined area. To page through the objects
click the Up and Down arrows.
4. Select the chart object to be annotated from
the Results list.
5. If the object is a point (for
example, a buoy or
navigation marker) or an
area the object or area is
highlighted with a lighter,
transparent background and with a white
outline. If the object is a line (e.g. submarine
cable) the line is displayed in white.