10-10
Agilent 7500 ICP-MS ChemStation Operator’s Manual
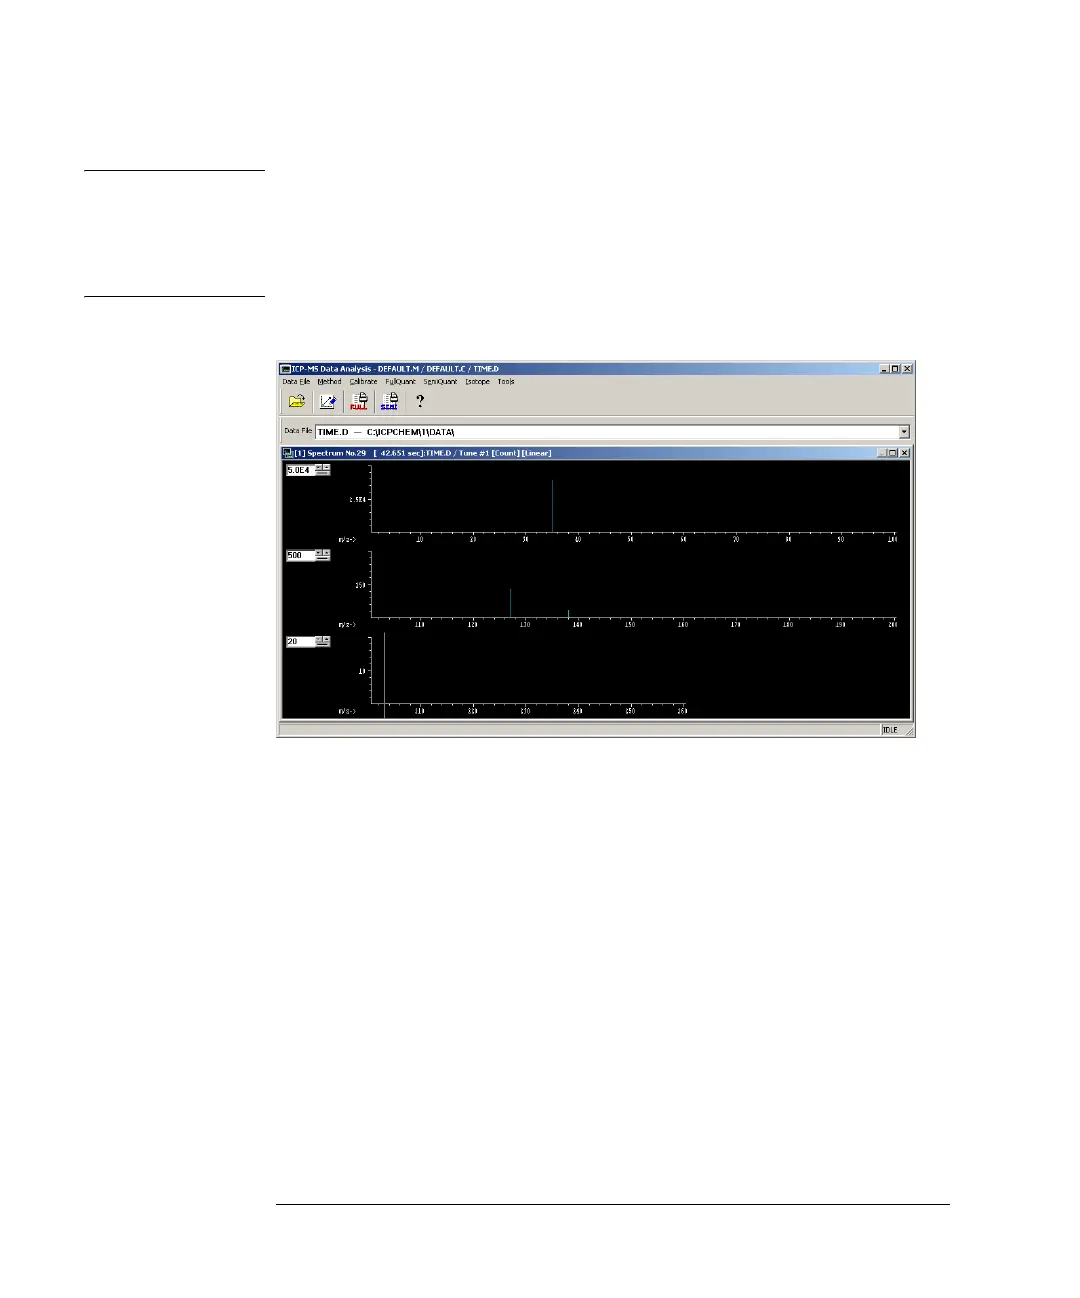
Viewing a Time Chart
NOTE You can also view mass spectrum information for any time slice in a time chart. To
do so, position the cursor at the time of interest in the Time Chart display and
double-click the right mouse button. The data displayed at that time slice in the time
chart appears in a Mass Spectrum display. To return to the Time Chart display,
double-click the Control Box Menu in the Mass Spectrum display window.
Mass Spectrum for a Time Slice

 Loading...