3. Operation of CON Related Controllers
144
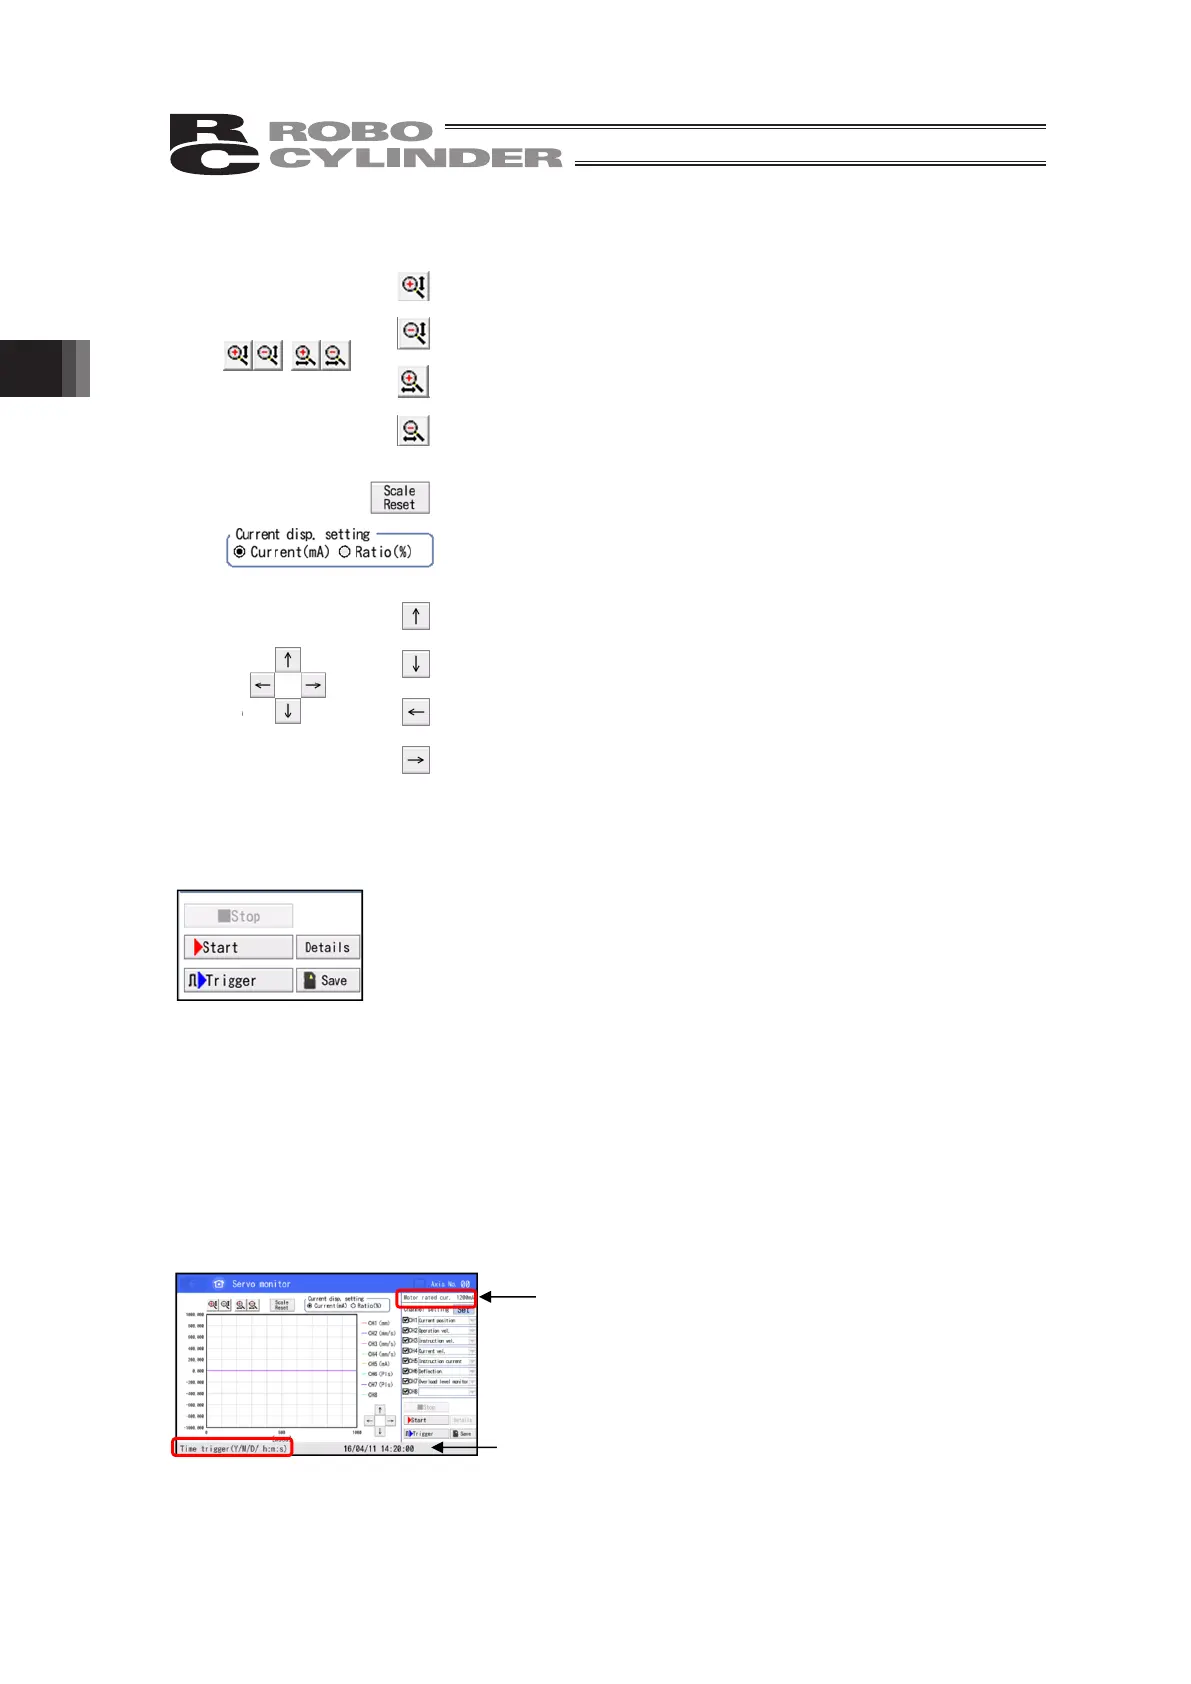
3.25.1.2 Display Setting Buttons
: Touch it to enlarge the scale of the graph in vertical axis.
: Touch it to reduce the scale of the graph in vertical axis
: Touch it to enlarge the scale of the graph in horizontal axis
: Touch it to reduce the scale of the graph in horizontal axis
: Touch it to initialize the scale of the graph.
: Current Display Setting: System to display current can be selected
: Touch it to slide the displayed waveform frame upwards.
: Touch it to slide the displayed waveform frame downwards.
: Touch it to slide the displayed waveform frame to the left.
: Touch it to slide the displayed waveform frame to the right.
3.25.1.3 Monitor Operation Buttons
[Start] : Touch it to start monitoring.
[Stop] : Touch it to stop monitoring and trigger standby.
[Trigger] : Monitoring starts once the triggering conditions are
satisfied.
Refer to 3.25.3 Trigger Setting
[Details] : Touch it to display the window to conduct sampling frequency
setting and trigger setting.
Refer to 3.25.2 Sampling Frequency Setting and 3.25.3 Trigger
Setting
It is available to touch when [Confirm] button is not on.
[Save] : Touch it to save the acquired data to a Secure Digital memory
card in the CSV format.
Refer to 3.25.4.1 How to Save Waveform Data for the details of
procedures
3.25.1.4 Other Displays
Motor Rated Current : It shows the motor rated current.
Setting Trigger Occurred Time (YY/MM/DD HH:MM:SS) : It shows the time when the triggering
conditions are satisfied and monitoring is
started.
Motor Rated Current
Settin
Tri
er Occurred Time
YY/MM/DD HH:MM:SS
 Loading...