Common Analysis and Display Functions
R&S
®
FSW
549User Manual 1173.9411.02 ─ 43
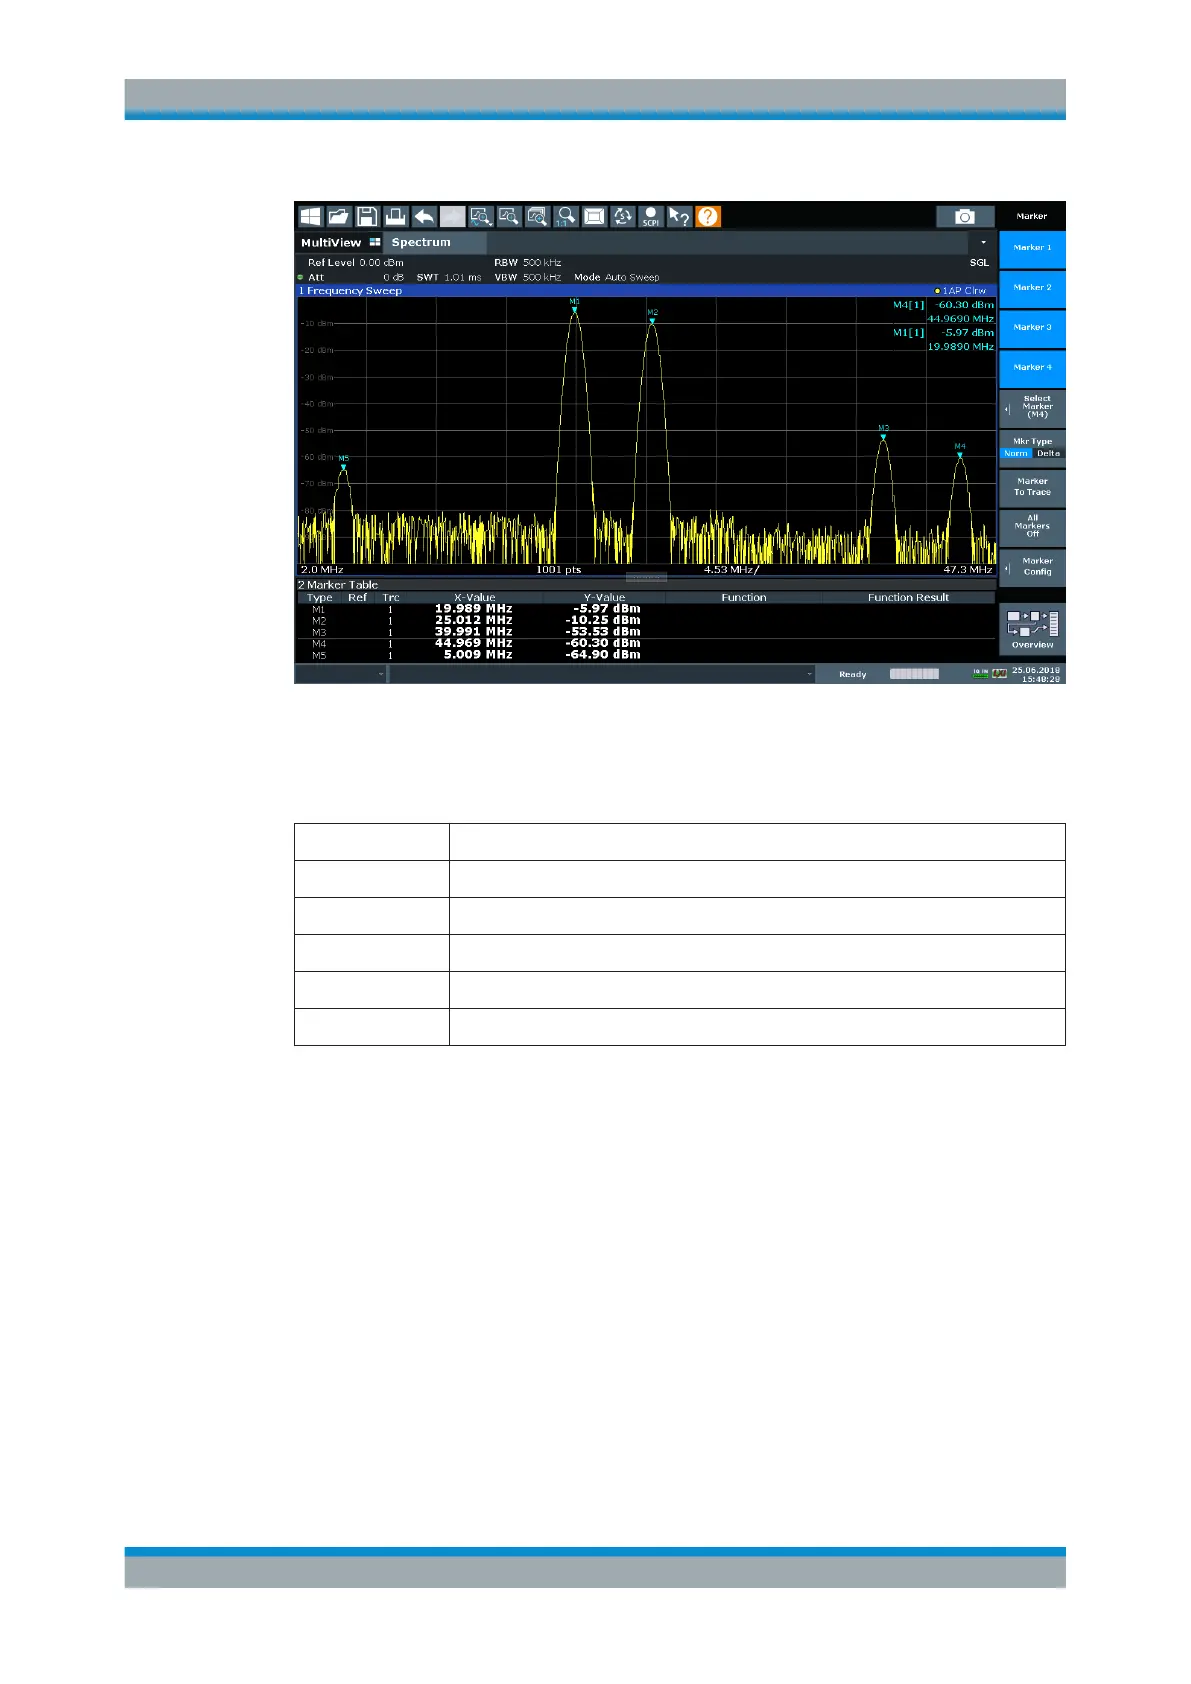
Figure 9-6: Trace example
The following table lists the peaks as indicated by the marker numbers in the diagram
above, as well as the minimum decrease in amplitude to either side of the peak:
Marker # Min. amplitude decrease to either side of the signal
1 80 dB
2 80 dB
3 55 dB
4 39 dB
5 32 dB
In order to eliminate the smaller peaks M3, M4 and M5 in the example above, a peak
excursion of at least 60 dB is required. In this case, the amplitude must rise at least
60 dB before falling again before a peak is detected.
Marker peak list
The marker peak list determines the frequencies and levels of peaks in the spectrum. It
is updated automatically after each sweep. How many peaks are displayed can be
defined, as well as the sort order. In addition, the detected peaks can be indicated in
the diagram. The peak list can also be exported to a file for analysis in an external
application.
Automatic peak search
A peak search can be repeated automatically after each sweep in order to keep the
maximum value as the reference point for a phase noise measurement. This is useful
to track a drifting source. The delta marker 2, which shows the phase noise measure-
Marker Usage

 Loading...


