Common Analysis and Display Functions
R&S
®
FSW
617User Manual 1173.9411.02 ─ 43
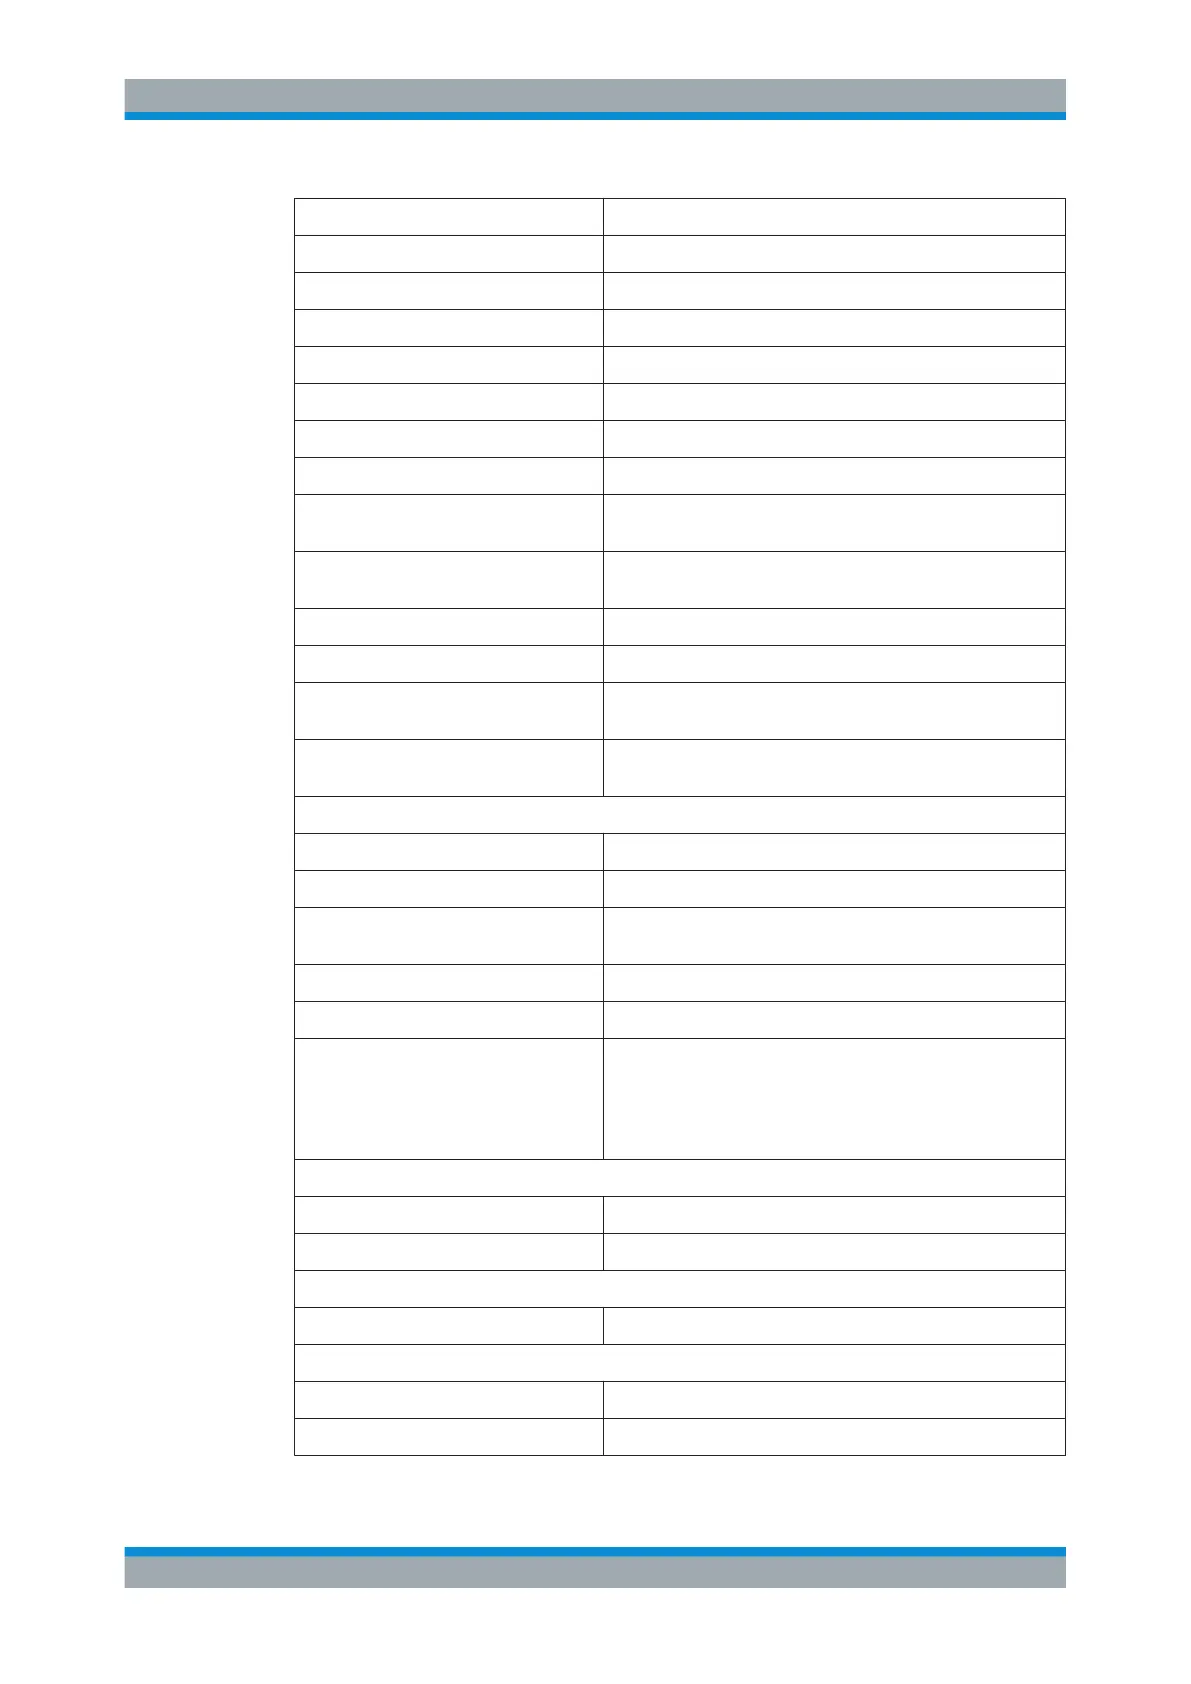
File contents Description
Level Offset;0;dB Level offset
Rf Att;20;dB Input attenuation
El Att;2.0;dB Electrical attenuation
RBW;100000;Hz Resolution bandwidth
VBW;30000;Hz Video bandwidth
SWT;0.005;s Sweep time
Sweep Count;20; Number of sweeps set
Ref Position;75;% Position of reference level referred to diagram limits (0 % =
lower edge)
Level Range;100;dB Display range in y direction. Unit: dB with x-axis LOG, % with x-
axis LIN
x-Axis;LIN; Scaling of x-axis linear (LIN) or logarithmic (LOG)
y-Axis;LOG; Scaling of y-axis linear (LIN) or logarithmic (LOG)
x-Unit;Hz; Unit of x values: Hz with span > 0; s with span = 0; dBm/dB
with statistics measurements
y-Unit;dBm; Unit of y values: dB*/V/A/W depending on the selected unit
with y-axis LOG or % with y-axis LIN
Data section for individual window
Window;1;Frequency Sweep Window number and name
Trace 1;; Selected trace
Trace Mode;AVERAGE; Display mode of trace: CLR/WRITE,AVER-
AGE,MAXHOLD,MINHOLD
Detector;AUTOPEAK; Selected detector
Values; 1001; Number of measurement points
10000;-10.3;-15.7
10130;-11.5;-16.9
10360;-12.0;-17.4
...;...;
Measured values: <x value>, <y1>, <y2>; <y2> being available
only with detector AUTOPEAK and containing in this case the
smallest of the two measured values for a measurement point.
Data section for individual trace
Trace 2;; Next trace in same window
...
Data section for individual window
Window;2 ..; Name of next window
Data section for individual trace
Trace 1;; First trace
...
Importing and Exporting Measurement Results for Evaluation

 Loading...


