Chapter 16. Data Viewer Reference
To create a summed plot:
Select the plots to be summed and click the Sum button. (See page 104 for an
example.)
To zoom in and out on a plot:
Click on the “+” magnifying glass icon in the chart
toolbar. Then, either click once on the plot display
area, or drag-select a region to zoom in on it. To zoom out, click on the “−”
magnifying glass icon and then on the plot. By default, the zoom buttons are
“sticky.” To have the zoom buttons reset themselves after each click, right-click
on the plot display area and uncheck the option “Keep zoom after each click.”
(See also “To change plot axis limits” on the next page.)
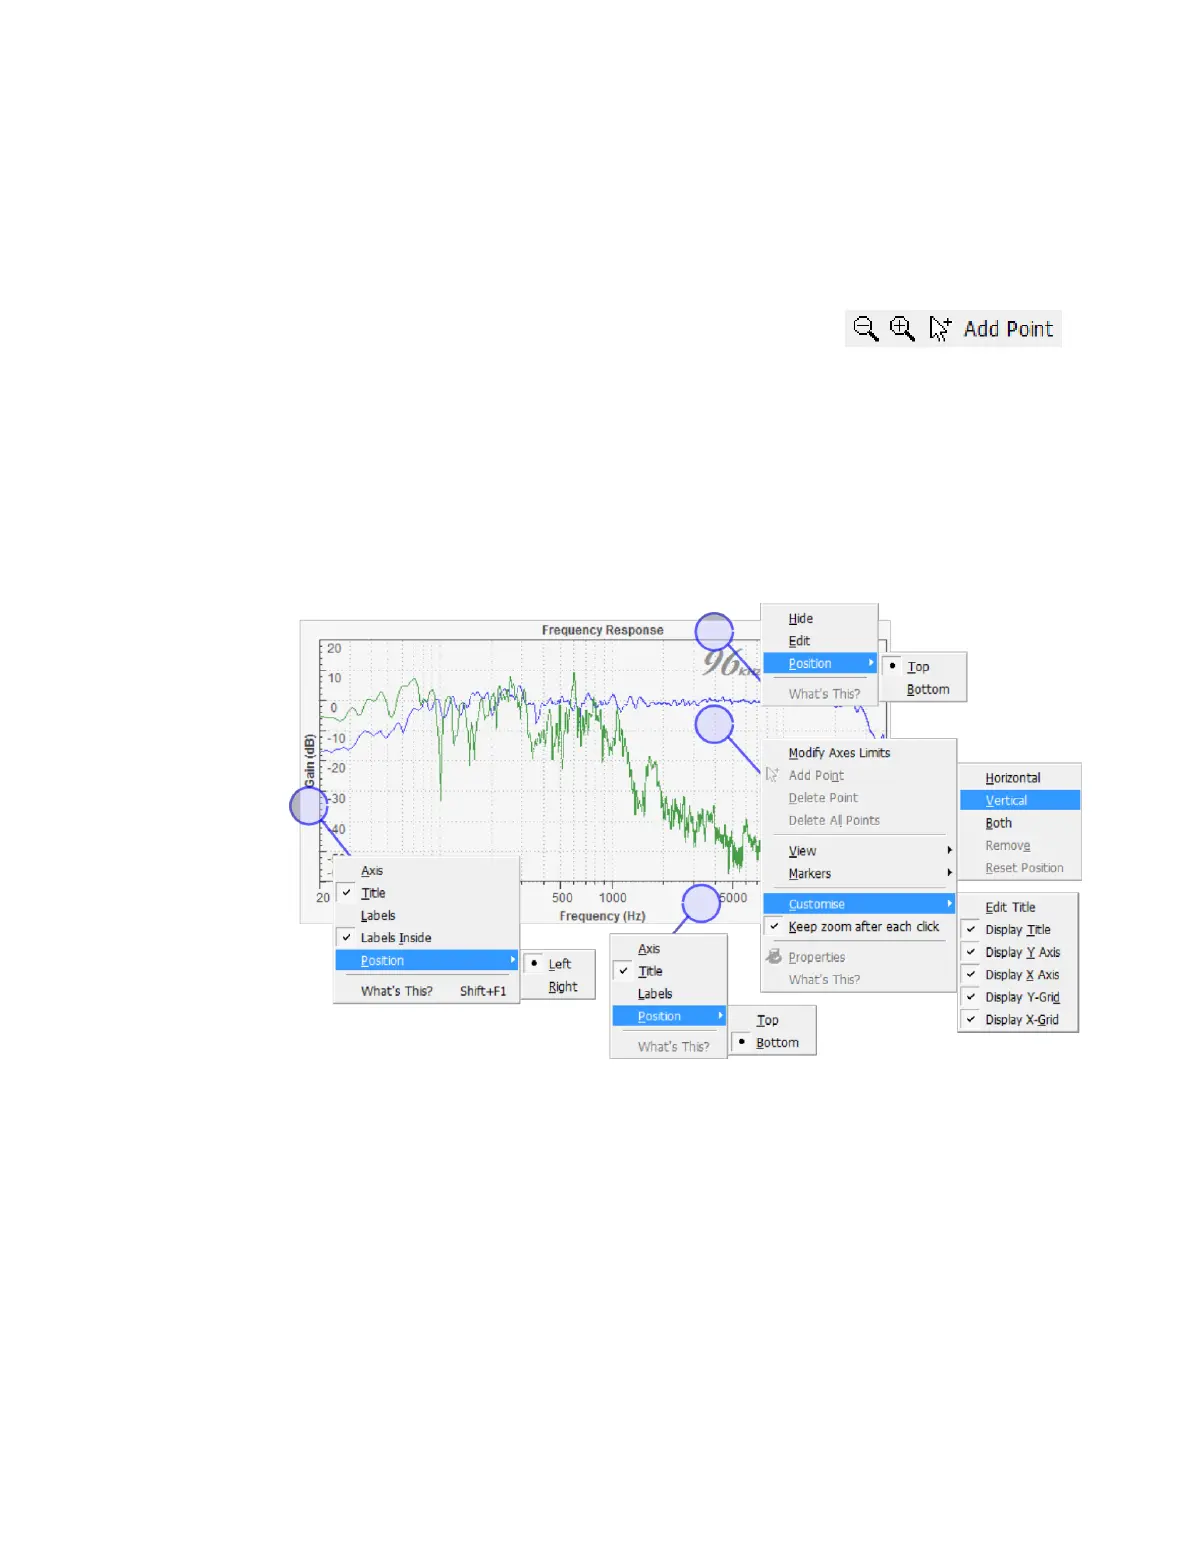
The plot display area responds to a right-button mouse-click by bringing up a context
menu. The menu entries depend on where the click is, as shown in this overlay:
To change the title of a plot:
Right-click on the title bar and select “Edit.” Type in the new name and click OK.
To disable the X or Y-axis display
Right-click on either axis and turn off the “Axis” entry. Alternatively, right-click on
the main plot display area, open the “Customize” sub-menu, and turn off “Display
X Axis” or “Display Y Axis.”
To disable the chart grid:
Right-click on the main plot display area, open the “Customize” sub-menu, and
turn off “Display X-Grid” or “Display Y-Grid.”