DEQX User Manual
To add markers to the plot:
Right-click on the plot display area,
open the “Markers” sub-menu, and
select either “Vertical” or “Horizontal.”
The markers can then be dragged to
the desired location.
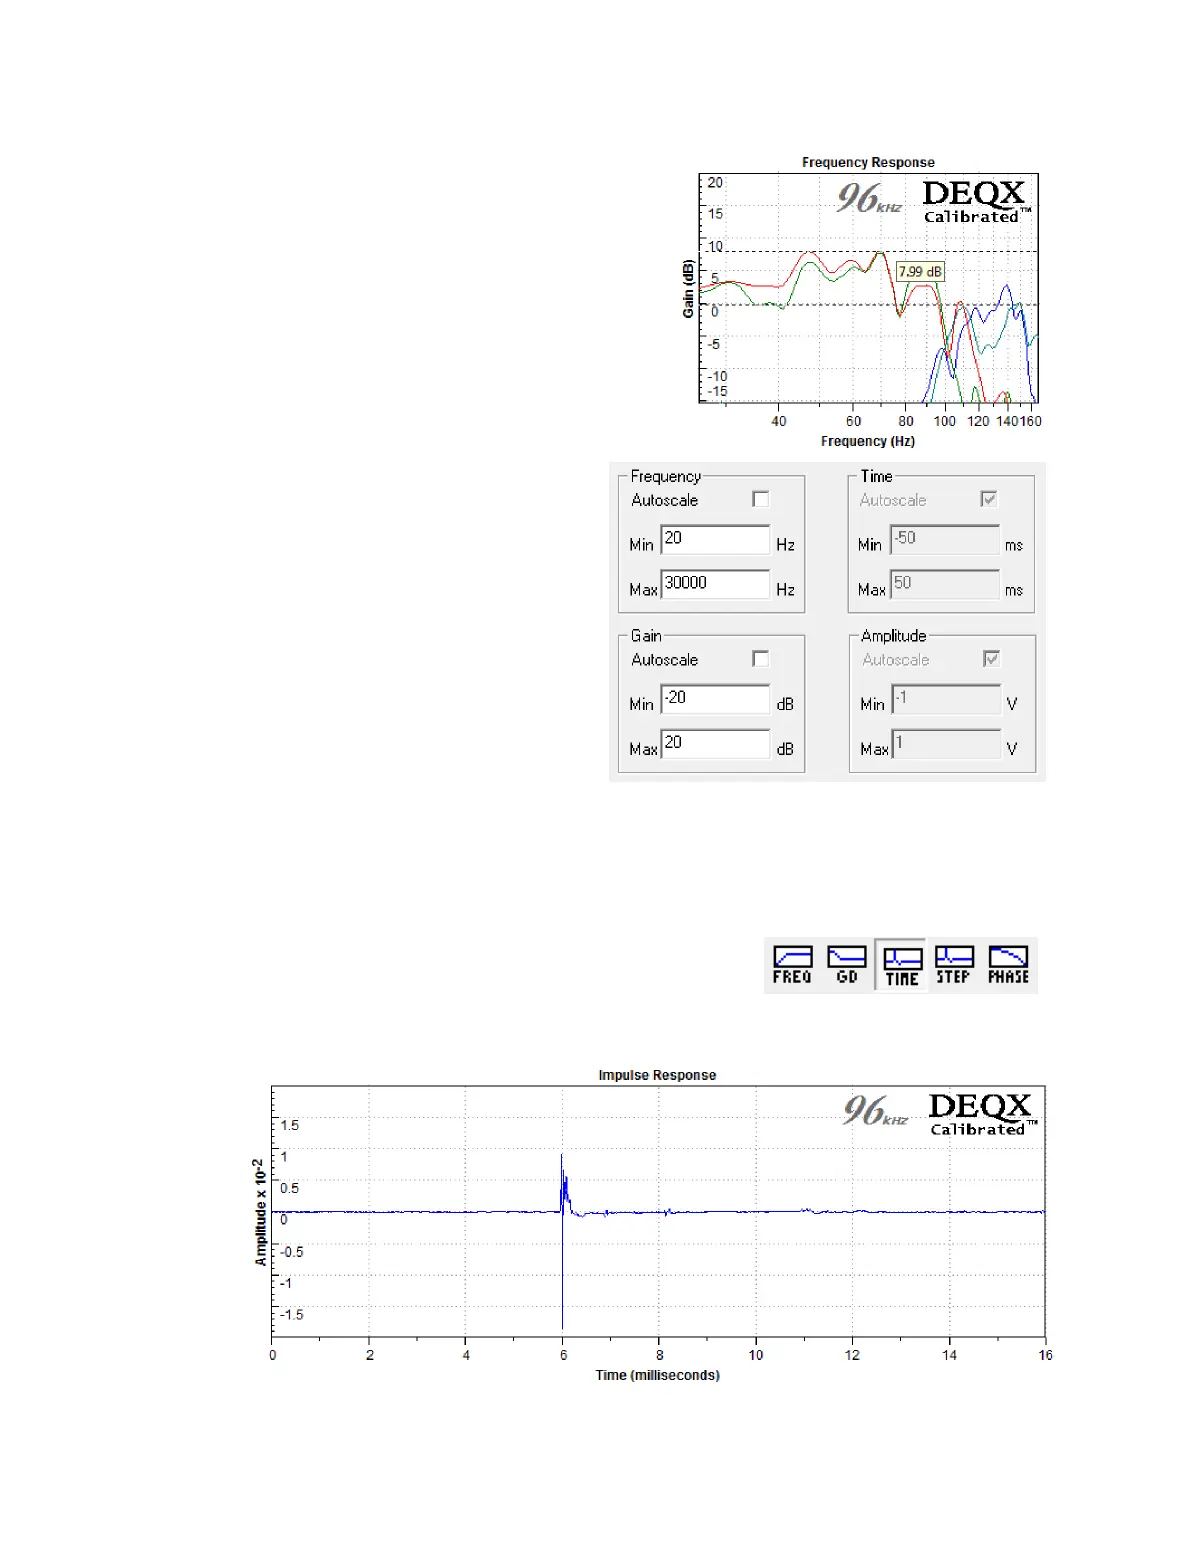
To change plot axis limits:
The “+” and “−” magnifying
glass icons change the
displayed plot range within the
overall limits, which are by
default set automatically. To
set these limits manually,
right-click on the plot display
area and select “Modify Axes
Limits.” Uncheck the
Autoscale checkboxes and
enter the desired limits.
Other changes to the plot display can be made in the Chart tab of the Options dialog
(pages 153 and 154).
16.5 VIEWING THE IMPULSE RESPONSE
Click the TIME button on the chart toolbar to display
the impulse response of the selected measurements.
The impulse response is used to calculate timing
delays (see pages 56 and 95 for examples).