DEQX User Manual
12.1 HOW TO USE MANUAL EQ
To add an EQ control point, right-click on the plot and select
“Add Point” from the menu, or click the Add Point button in the
chart toolbar. Then click on the plot display area.
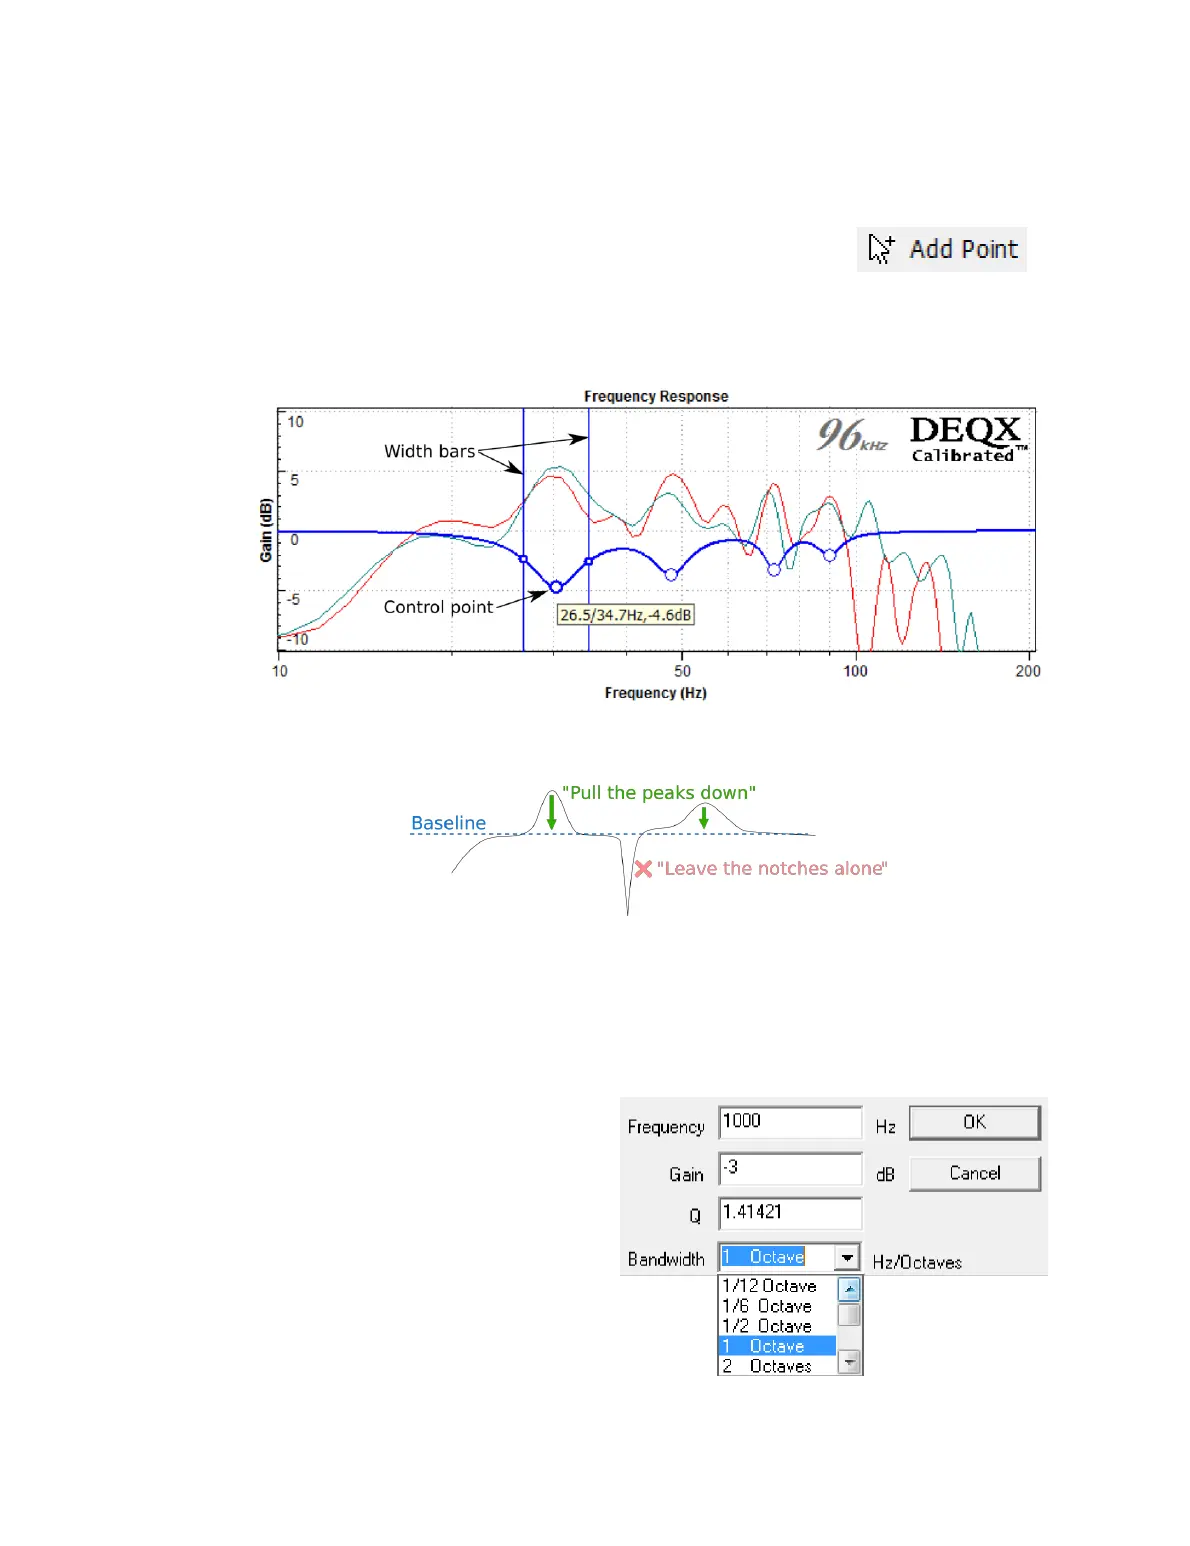
The example below shows an EQ curve for stereo subwoofers with four control points
added. (The plot has been zoomed in to show the frequency range from 10 to 200 Hz.)
In this example, the EQ curve is set to “pull the peaks down.” This can be done because
the subwoofers’ Scale has been set so that their baseline is at about 𝟢 dB.
To change the center frequency and gain of a filter band, click and drag the control
point. To change the width, click and drag either of the two vertical bars. These bars are
located at the “half way" points of the filter. (For example, if the filter is set for a gain of
−6 dB, the bars are at the frequencies of −3 dB gain.) As a general rule, narrow filters are
used at low frequencies and wider filters are used at higher frequencies. All changes are
“live,” so the effect can be heard while listening to music.
A tooltip overlay displays the
parameters of a filter band. Exact
parameters can be set by double-
clicking on the control point to bring
up the dialog box shown at right.
Frequency
The center frequency of the
filter band.