DEQX User Manual
16.4 OPERATING ON MEASUREMENTS
The chart toolbar, viewer toolbar, and plot selector provide a comprehensive set of
functions for viewing and manipulating measurement plots.
To select individual plots for display:
Click on the checkboxes in the Show column of the plot selector.
To change plot color or line style:
Click in the Col or Line column and select a color or line style.
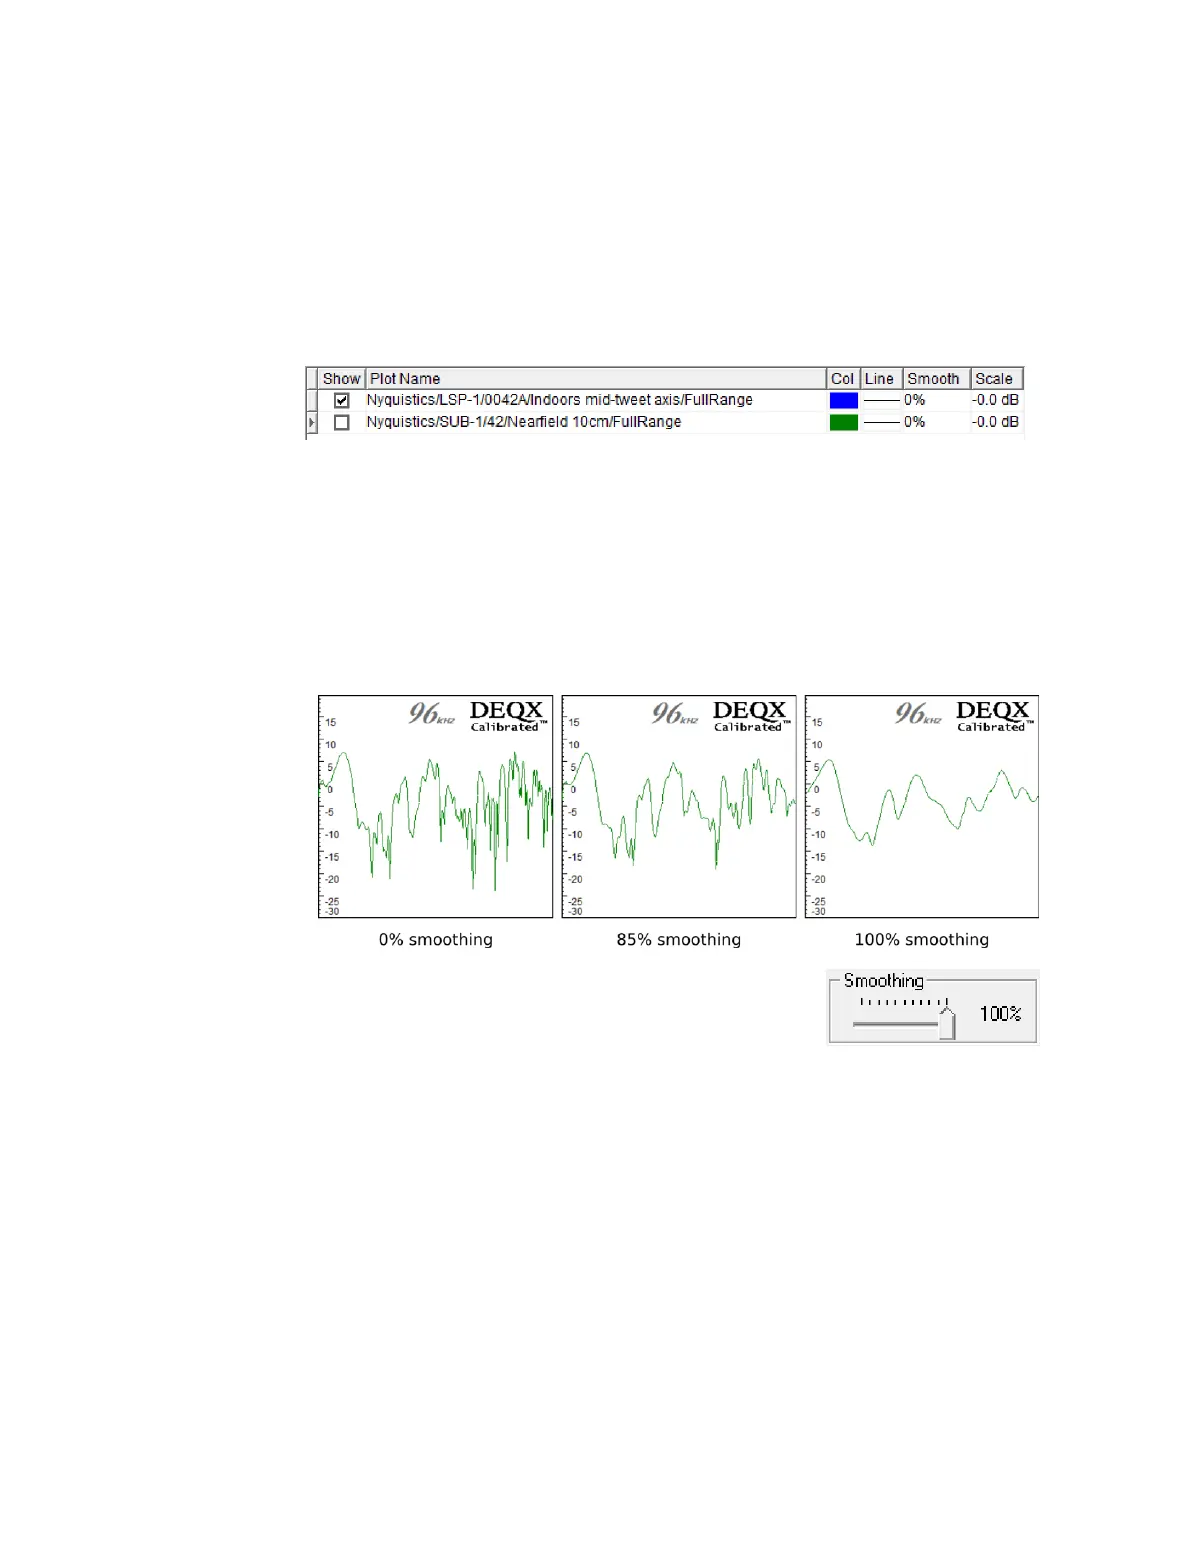
To set plot smoothing:
Click in the Smooth column and type in the new smoothing amount (𝟢 to 𝟣𝟢𝟢%).
Smoothing serves to make measurements more legible by removing comb
filtering (particularly when measuring indoors). It is also an adjustment that is
made to control speaker calibration (see pages 57 and 114 for examples).
In addition to the individual adjustment for each plot,
all selected plots can have their smoothing changed
with the slider at the left of the viewer toolbar.
To change plot scale:
Click in the Scale column and enter a value. This value adjusts the offset of the
plot relative to the decibel scale on the left hand side. It is used to align plots to
calculate gain levels and to aid in room EQ. (See page 93 for an example.)
To normalize plots:
Click the Normalize to 𝟢 dB button. The selected plots will have their scale values
changed so that the signal level is nominally at 𝟢 dB.
To remove a plot or plots from the display:
Select the plots to be removed and click the Remove button.