11.2 Settings for Waveform Calculation
196
11.2.3 Changing the display method for calculated
waveforms
Procedure
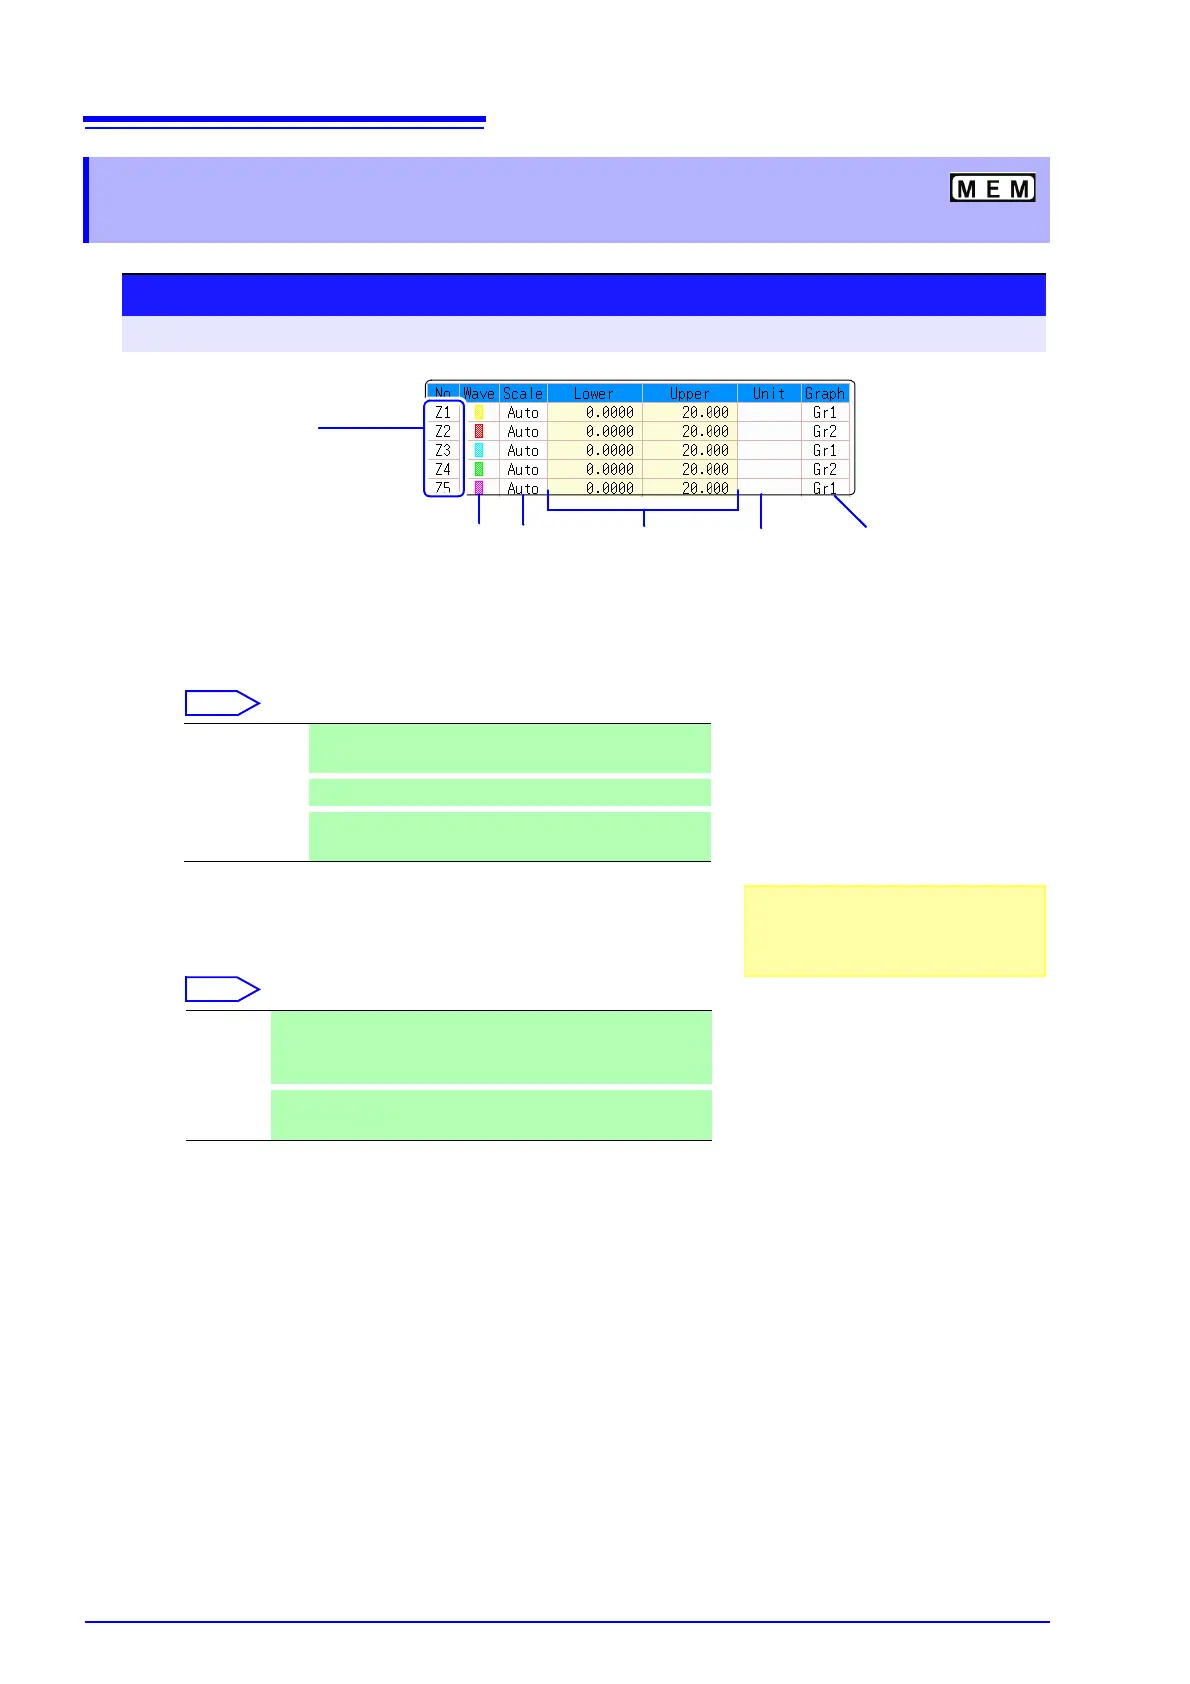
To open the screen: Press the STATUS key → [Wave Calc] sheet
1
Enable waveform display, and display color
Move the cursor to the [Wave] column.
2
Select a method to set scaling
Move the cursor to the [Scale] column for the Calculation No. to be set.
3
Set the upper and lower limits of the display range (when
[Manual] is selected)
Select [Lower] and [Upper].
Select an entry method and enter the limit values.
Entry range: -9.9999E+29 to +9.9999E+29
See: "8.1.3 Alphanumeric Input" ( p.121)
4
Specify the physical units
Move the cursor to the [Unit] column.
Select an entry method and enter the physical units.
See: "8.1.3 Alphanumeric Input" ( p.121)
5
Select the graph to be displayed.
(When split screen ([Format] item on the [Status] sheet) is
[Dual] or higher)
Move the cursor to the [Graph] column and select the graph number.
Waveform
color
Upper and
lower limits
Displayed
measurement
units
Display
range set-
ting method
Calculation No.
To copy settings
between Calculation Nos.:
Select F1 [Copy].
12 43
Graph to display
6
1
On-Off Set On to display the waveform of the flashing cursor
column (default setting). Set to Off to hide display.
2 ↑↓
Select the waveform color.
3
All On-Off Select On to display all waveforms. Select Off to hide all
waveforms.
1
Auto Automatically sets the display range of the vertical axis. (After
calculation, the upper and lower limits are obtained from the
results, and set automatically.)
2
Manual Upper and lower limits of the vertical axis display range are
entered manually.
Depending on calculation results, auto-
matic scaling settings may be unsatisfac-
tory, in which case the limits must be
entered manually.