13.3 Setting FFT Analysis Conditions
219
13
Chapter 13 FFT Function
By specifying a setting factor (rate) to be applied to the input signal, the display of data exceeding the result-
ing threshold can be emphasized. This feature is useful for viewing waveforms that may otherwise be
obscured by noise.
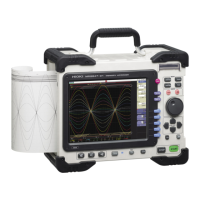
The reliability of phase spectrum values is poor when discrete Fourier transform values are extremely small.
For example, in the case of a pure sine wave, almost all phase values at frequencies other than the input fre-
quency result from calculation errors. By treating the maximum value of the power (or cross-power) spectrum
of the input signal,
P
max
, as a reference value, data that exceeds that value multiplied by rate R can be dis-
played with emphasis.
13.3.8 Emphasizing Analysis Results (phase spectra
only)
Power Spectrum
Phase Spectrum
Emphasis
Display
10logP
max
[dB]
10logRP
max
[dB]
Attenuation Rate and Value
Attenuation value: A [dB]
Attenuation rate: R
-A = 10log
10
R
1 x 10
-6
≤ R ≤ 1
0
≤ A ≤ 60
1
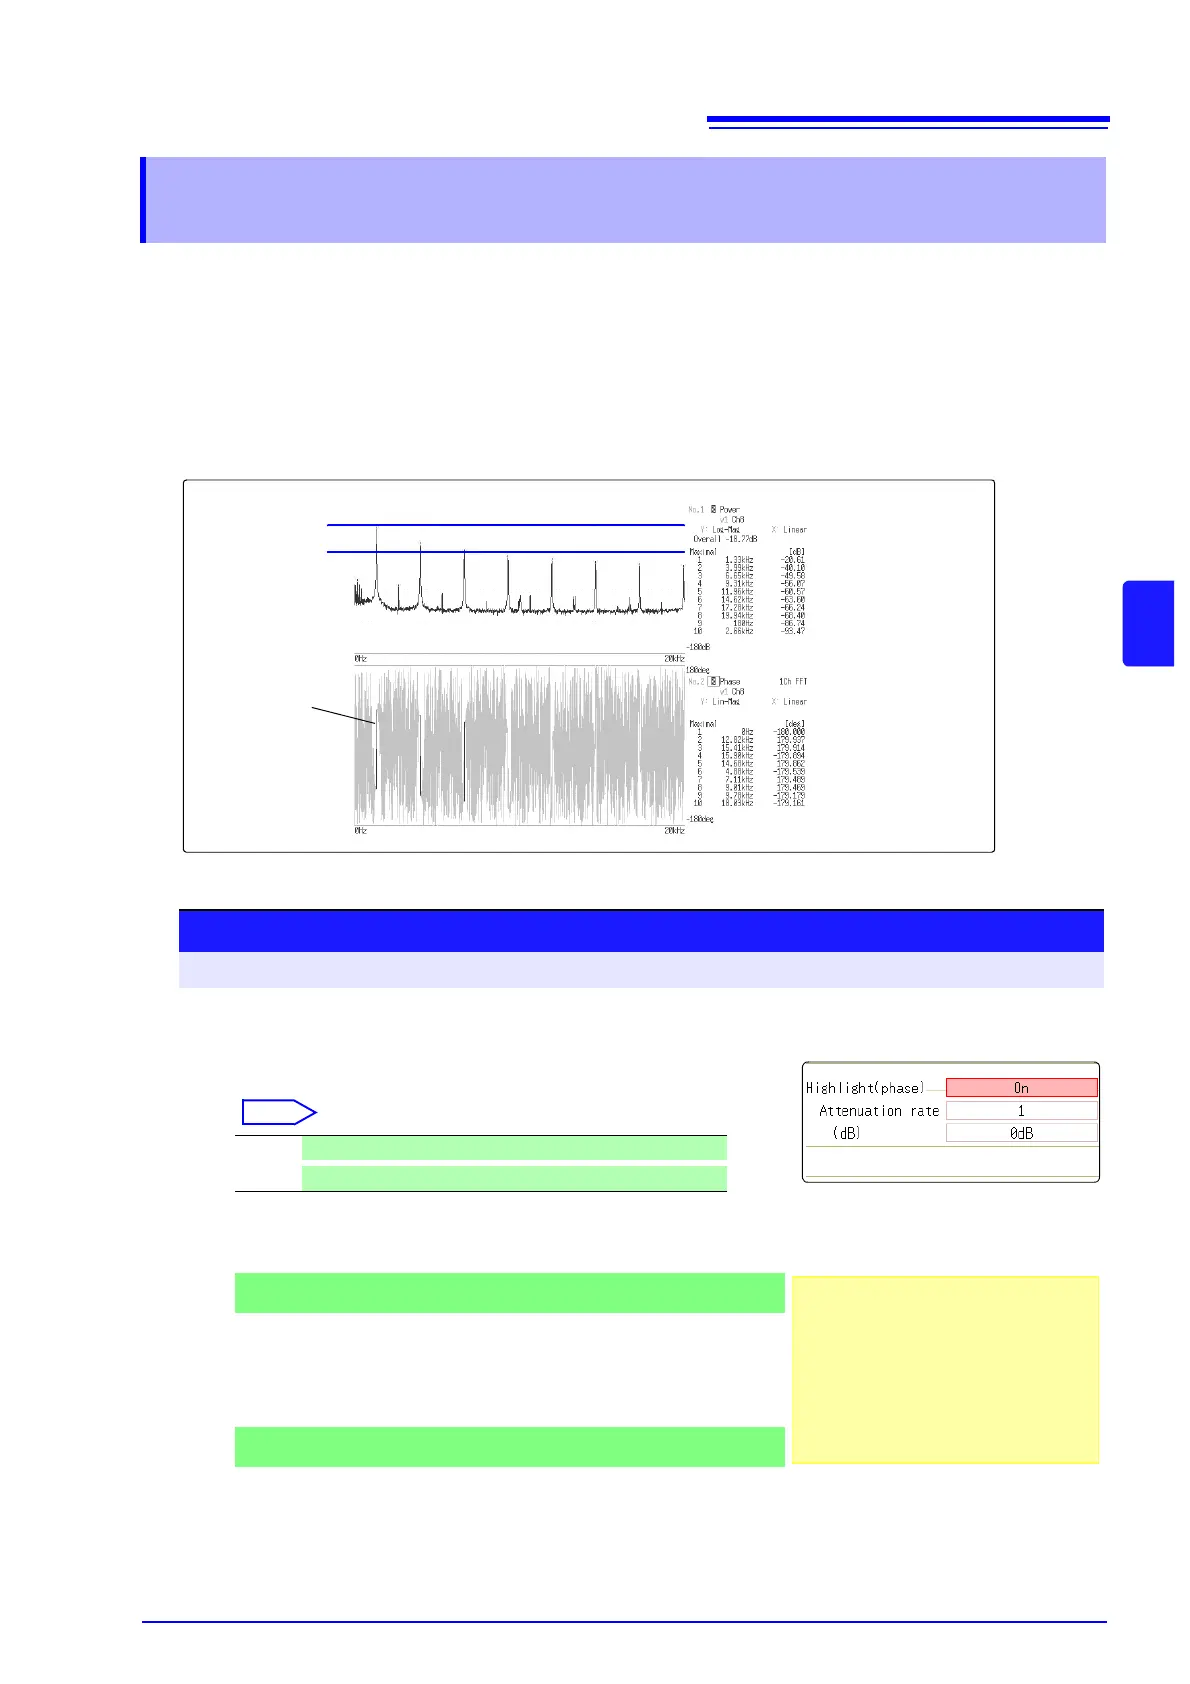
Enable the highlighting function.
Move the cursor to the [Highlight(phase)] item.
2
Set the attenuation rate or attenuation value.
To set an attenuation rate
Move the cursor to the [Attenuation rate] item.
Enter the attenuation rate.
See: "8.1.3 Alphanumeric Input" ( p.121)
To set an attenuation value [dB]
Move the cursor to the [(db)] item.
Enter the attenuation value.
See: "8.1.3 Alphanumeric Input" ( p.121)
Off Emphasis display disabled. (default setting)
On
Emphasis display enabled.
Procedure
To open the screen: Press the STATUS key → [Status] sheet
1
2
3