1
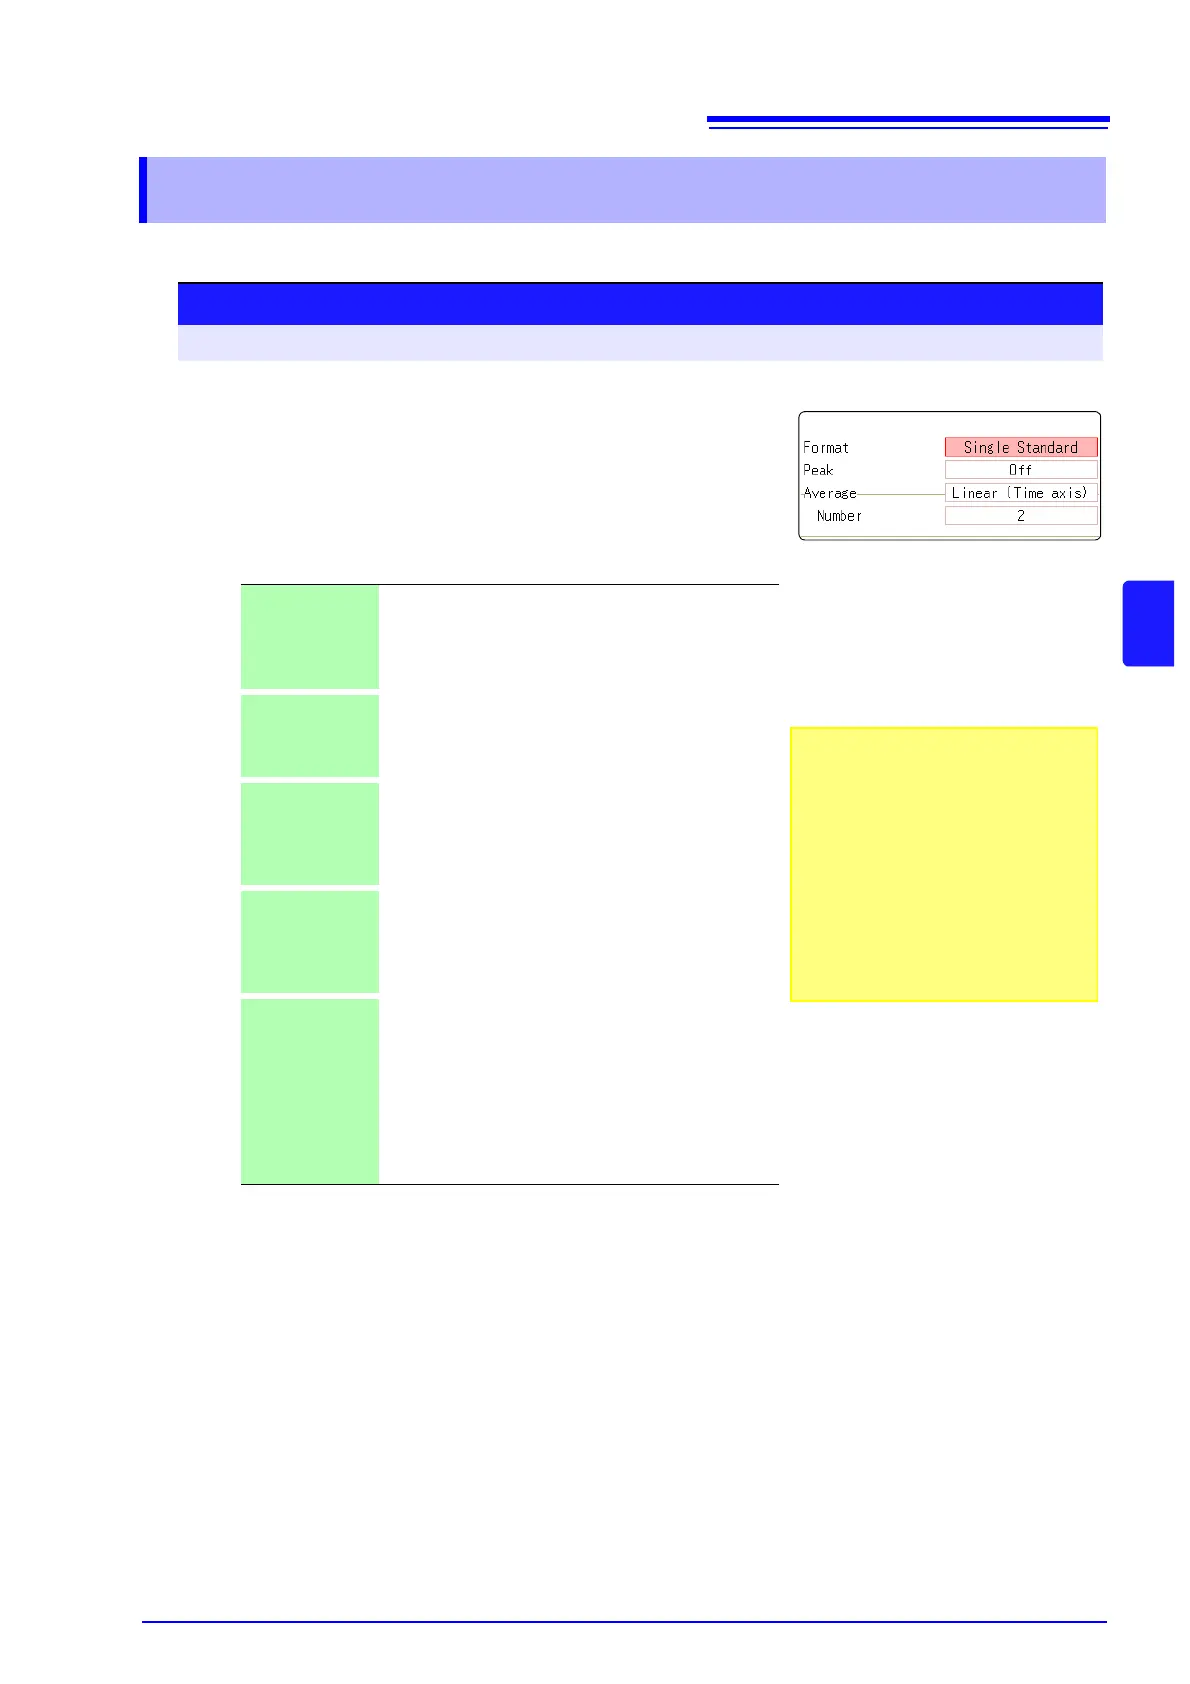
Select the display format.
Move the cursor to the [Format] item.
Select the format of data to be displayed.
The display format depends on the input data selected for analysis.
*: The horizontal axis and vertical axis display the real parts and the
imaginary parts of calculation results, respectively.
2
Press the DISP key to display the Waveform screen.
Single
Standard
The FFT calculation results are displayed in one screen.
If the calculations have multiple settings, waveforms are
overlaid.
Note: Depending on the analysis mode settings, analy-
sis No1 only may be preferentially displayed.
Dual Standard The FFT calculation results are displayed in two
screens.
If the calculations have multiple settings, waveforms are
displayed for each specified calculation.
Single Nyquist
*
If the analysis mode is linear spectrum, transfer function
or cross power spectrum, the FFT calculation result is
displayed in Nyquist display on one screen.
If the calculations have multiple settings, waveforms are
overlaid.
Dual Nyquist
*
If the analysis mode is linear spectrum, transfer function
or cross power spectrum, the FFT calculation result is
displayed in Nyquist display on two screens.
If the calculations have multiple settings, waveforms are
displayed for each specified calculation.
Running
spectrum
If the analysis mode is one of the following, analysis re-
sults are displayed three-dimensions: frequency, oscil-
lation and time.
(Linear spectrum, RMS spectrum, power spectrum,
power spectrum density, LPC analysis, transfer func-
tion, cross power spectrum, 1/1 octave analysis, 1/3 oc-
tave analysis)
If the calculations have multiple settings, No1 is prefer-
entially displayed.
Procedure
To open the screen: Press the STATUS key → [Status] sheet
To use an existing memory waveform
for analysis
Select [From Memory]as the input data
source [Reference].
See: "13.3.2 Selecting the Data Source
for Analysis" (
p.210)
To specify the analysis starting point
Specify the starting point on the memory
waveform.
See: "13.8.1 Analyzing after Specifying an
Analysis Starting Point" (
p.234)
1