13.9 FFT Analysis Modes
236
For the functions of each analysis mode, see"13.9.2 Analysis Mode Functions" ( p.254).
Waveform Example
Waveform Example
13.9 FFT Analysis Modes
13.9.1 Analysis Modes and Display Examples
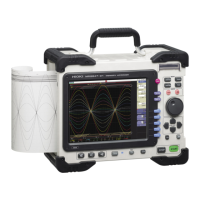
Storage
Displays the time axis waveform of the input signal.
When the window function setting is other than rectangular, the window function is applied to the
waveform and displayed.
Axis Display Type Description
X axis Linear
Time-domain display
Displays the value of the time-domain waveform corresponding to the set frequency
range.
See: "Relationship Between Frequency Range, Resolution and Number of Analysis
Points" (
p.212)
Y axis Lin-Mag
Displays the input module waveform
Window: Rectangular
X axis: Linear
Y axis: Lin-Mag
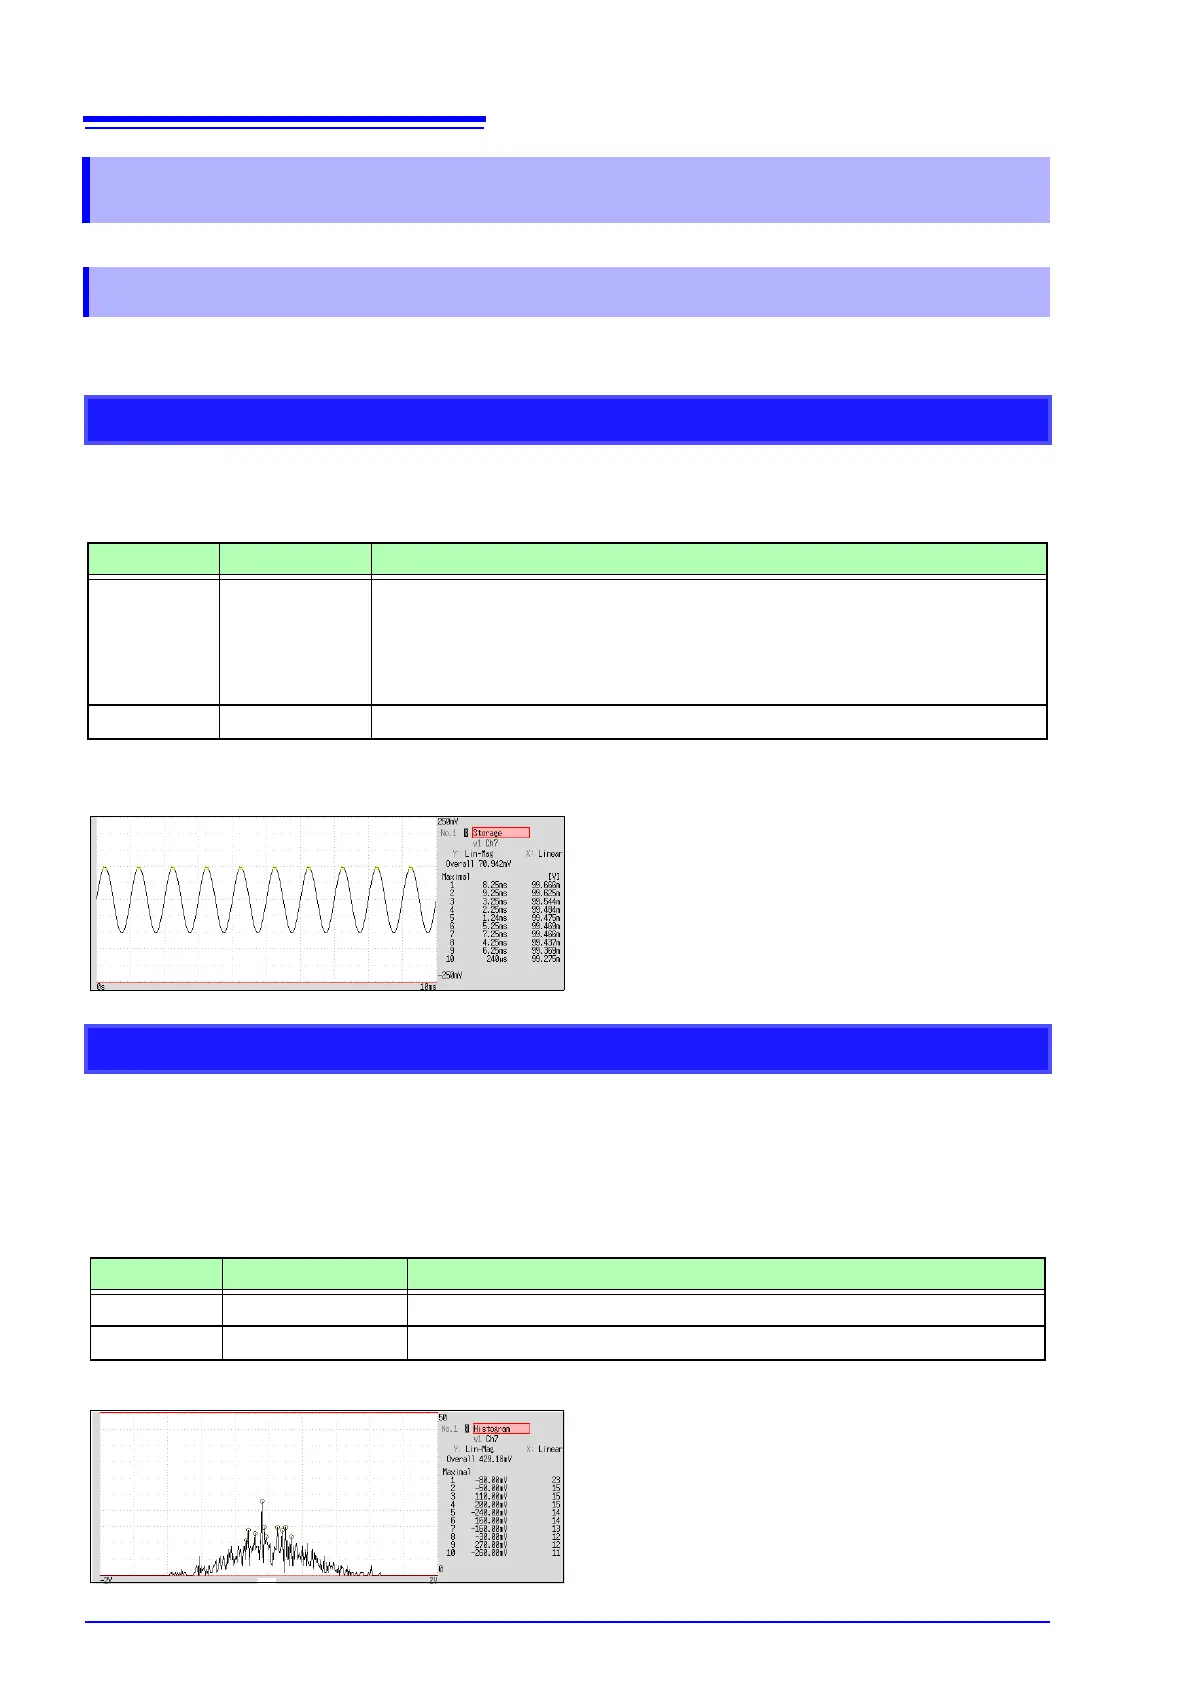
Histogram
Acquires the amplitude distribution of the input signal.
Main uses:
• To inspect deviations in the amplitude range of a waveform
• With analysis point distribution, to ascertain whether a waveform is artificial or natural (natural forms exhib-
iting regular distribution
See: About the Functions"13.9.2 Analysis Mode Functions" ( p.254)
Axis Display Type Description
X axis Linear
Displays input level of the input signal.
Y axis Lin-Mag
Displays analysis data distribution.
Normal display
X axis: Linear
Y axis: Lin-Mag