13.9 FFT Analysis Modes
237
13
Chapter 13 FFT Function
Waveform Example
Linear Spectrum
The linear spectrum plots the input signal frequency. It can be displayed as a Nyquist plot.
Main uses:
• To inspect the peak frequency contents of a waveform
• To inspect signal amplitudes at each frequency
See: About the Functions"13.9.2 Analysis Mode Functions" ( p.254)
Axis Display Type Description
X axis
Linear Frequency is displayed with equal spacing
Log Frequency display of logarithm interval
Nyquist display
The real-number component of analysis values are displayed linearly.
Y axis
Lin-Mag
Analysis values are displayed linearly.
Log-Mag
Analysis values are displayed as dB values. (0 dB reference value: 1eu)*
Lin-Real
The real-number component of analysis values are displayed.
Lin-Imag
The imaginary component of analysis values are displayed.
Nyquist display
The imaginary component of analysis values are displayed.
* eu: engineering units that are currently set are the standard (e.g., when the unit settings is volts, 0 dB = 1 V)
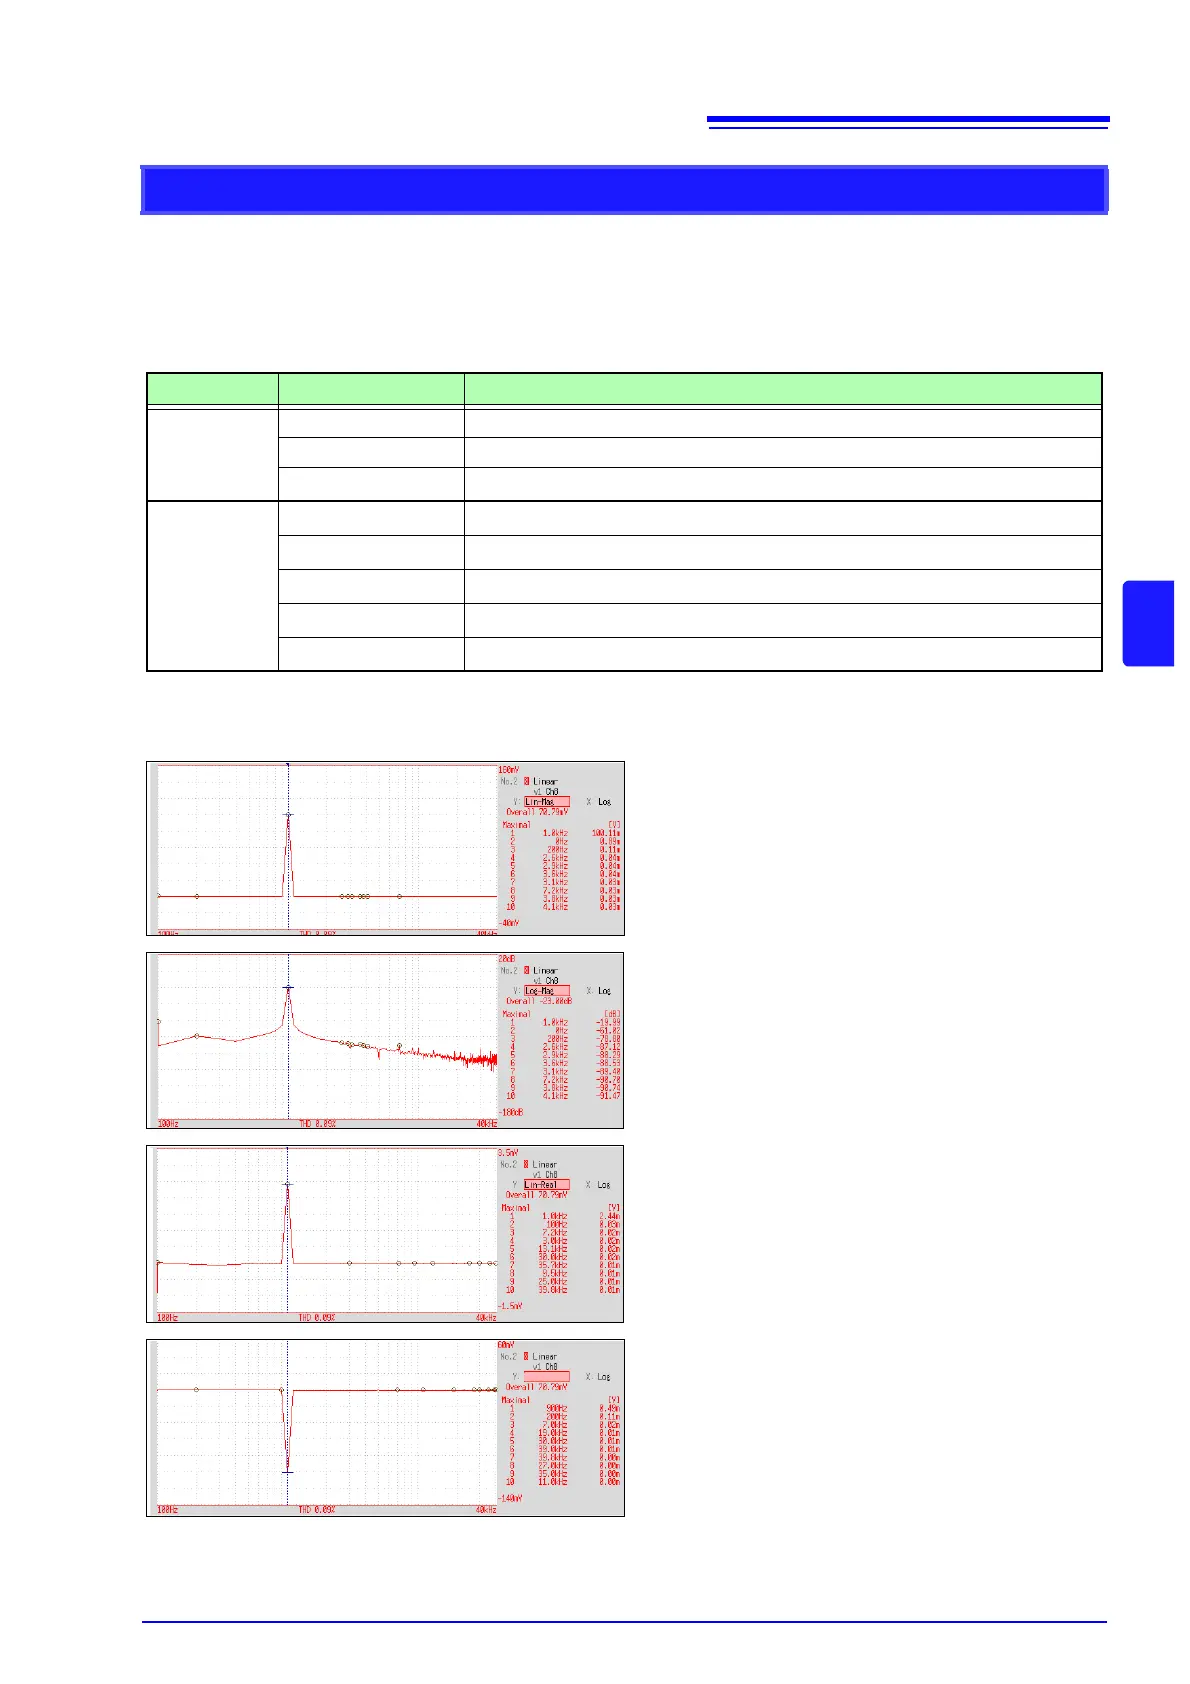
Normal display
X axis: Log
Y axis: Lin-Mag
Normal display
X axis: Log
Y axis: Log-Mag
Normal display
X axis: Log
Y axis: Lin-Real
Normal display
X axis: Log
Y axis: Lin-Imag